Carbon Certification Standards in Southeast Asia: Landscape Analysis (2025)
 

Overview

Southeast Asia is undergoing a rapid transition from a fragmented voluntary carbon market into a more sophisticated, policy-driven carbon ecosystem. Following several rounds of defining and updating their Nationally Determined Contributions (NDCs), Southeast Asian countries are building stronger policy and institutional environments to mitigate their emissions. These efforts are focused on integrating NDC goals into national and sectoral strategies and creating regulatory frameworks–such as national registries, carbon trading regulations, MRV systems, and emerging ETS structures–that allow project-based mechanisms to thrive. 

As these frameworks develop, carbon projects that align with these policies and strategies are better positioned to gain support from their host government. Yet policy recognition increasingly outpaces actual implementation, a notable emerging trend. Many standards are acknowledged in national frameworks, but only a smaller subset has widespread implementation on the ground. 

As Southeast Asian carbon markets develop, global businesses and stakeholders are witnessing a shift from pilot-level initiatives toward more scalable, investment-grade opportunities across the entire carbon services value chain. What was once a loose voluntary ecosystem is now being shaped by country-driven regulatory frameworks, especially the introduction of national registries and government-defined rules for how carbon projects must be developed and reported. This shift creates a structured environment, making it essential for businesses to navigate each country’s system with a deliberate and coordinated strategy. In this context, project developers, investors, and technical service providers must tailor their project design, financing structures, certification pathways, and MRV strategies to align with country-specific frameworks, opening significant commercial opportunities for firms that can offer bespoke advisory, legal, and technical services, such as regulatory due diligence, standard selection, carbon accounting, and market-readiness assessments among others. Stakeholders that are able to provide these customized capabilities will be best positioned to guide project proponents through increasingly formalized market requirements to secure high-quality credits. 

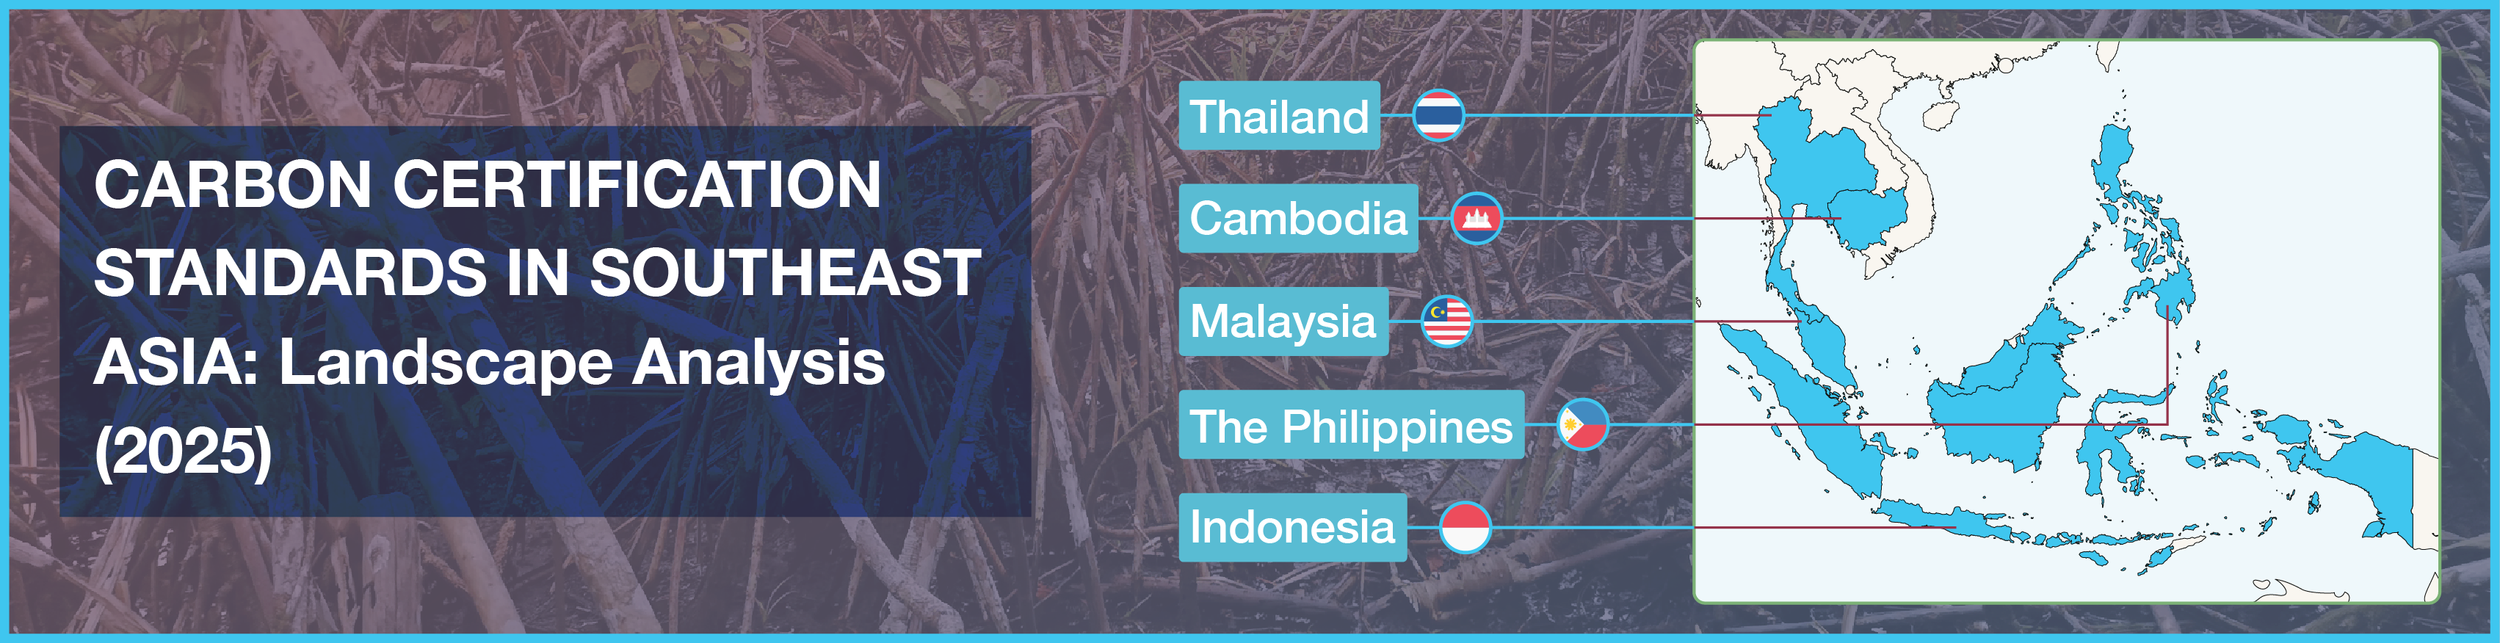
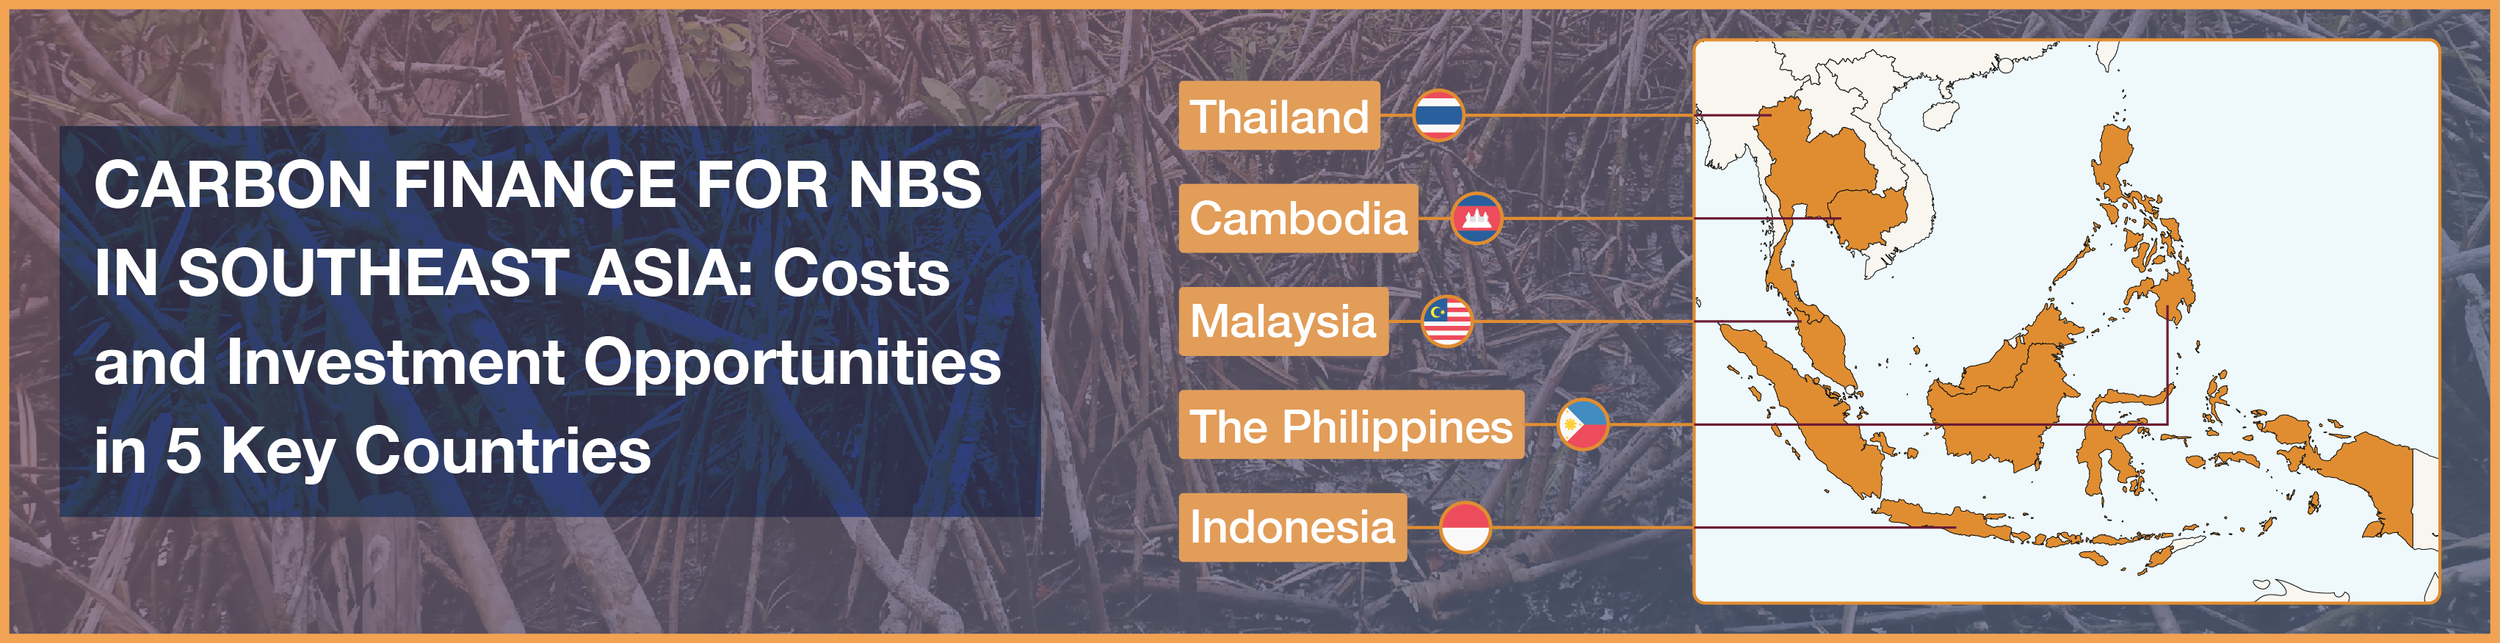
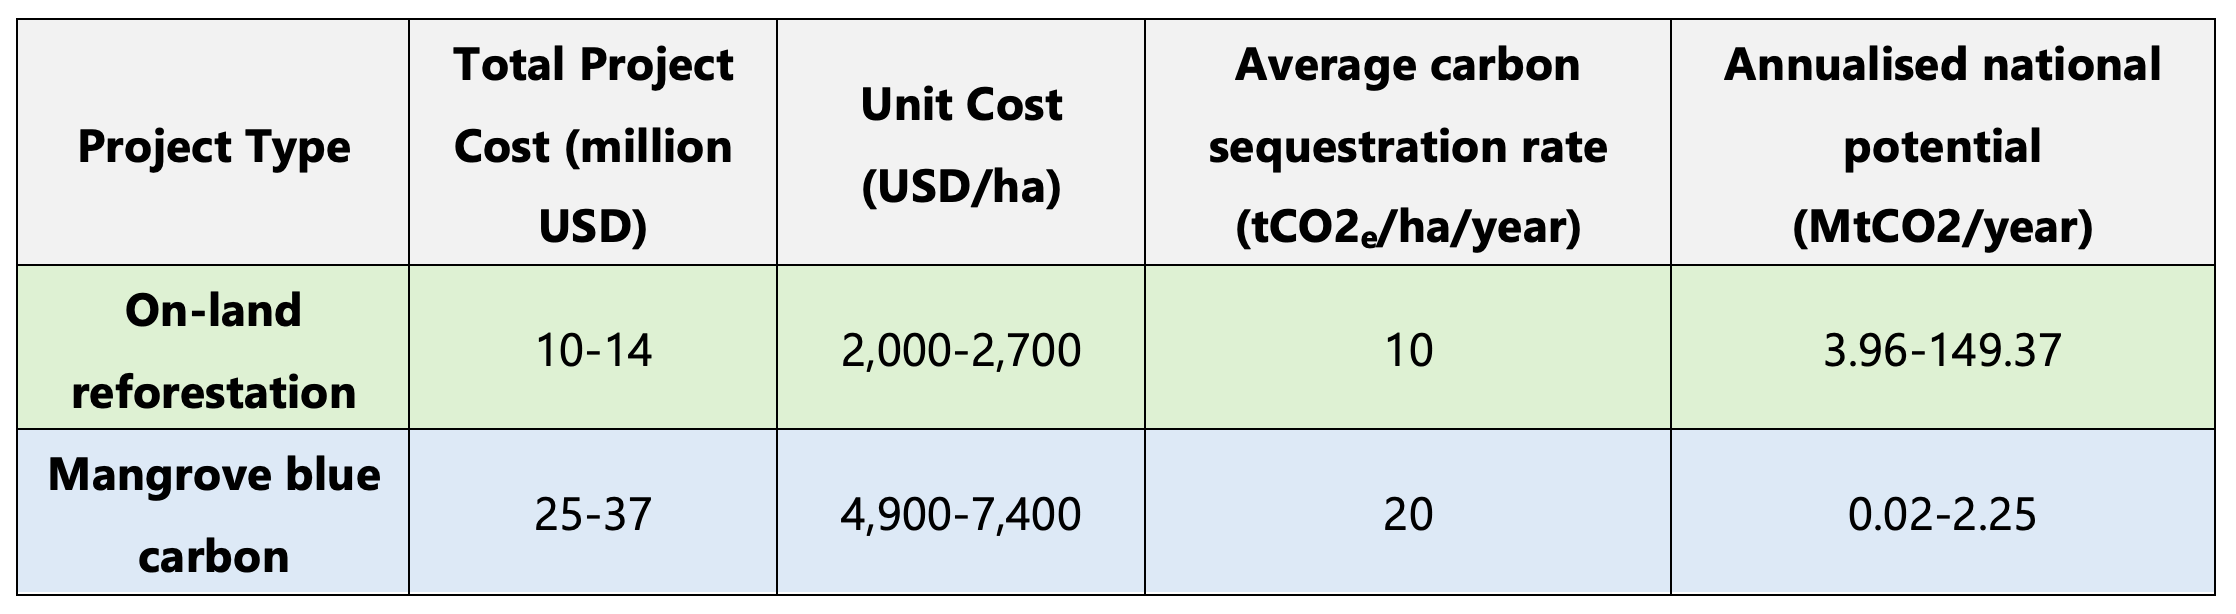
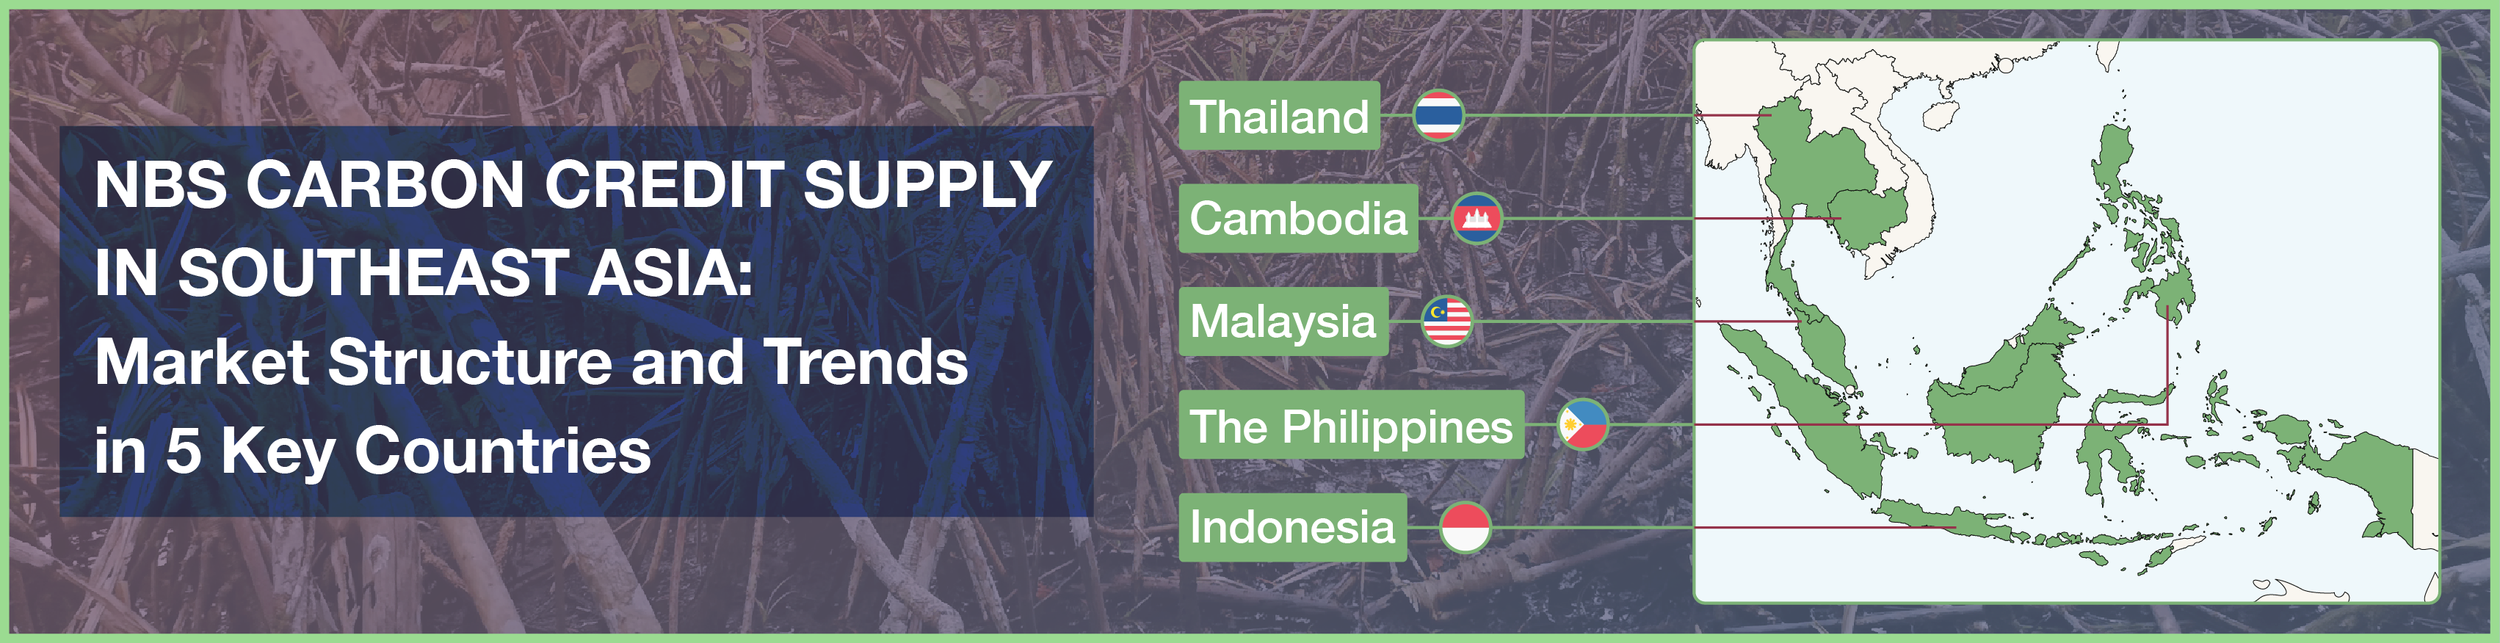
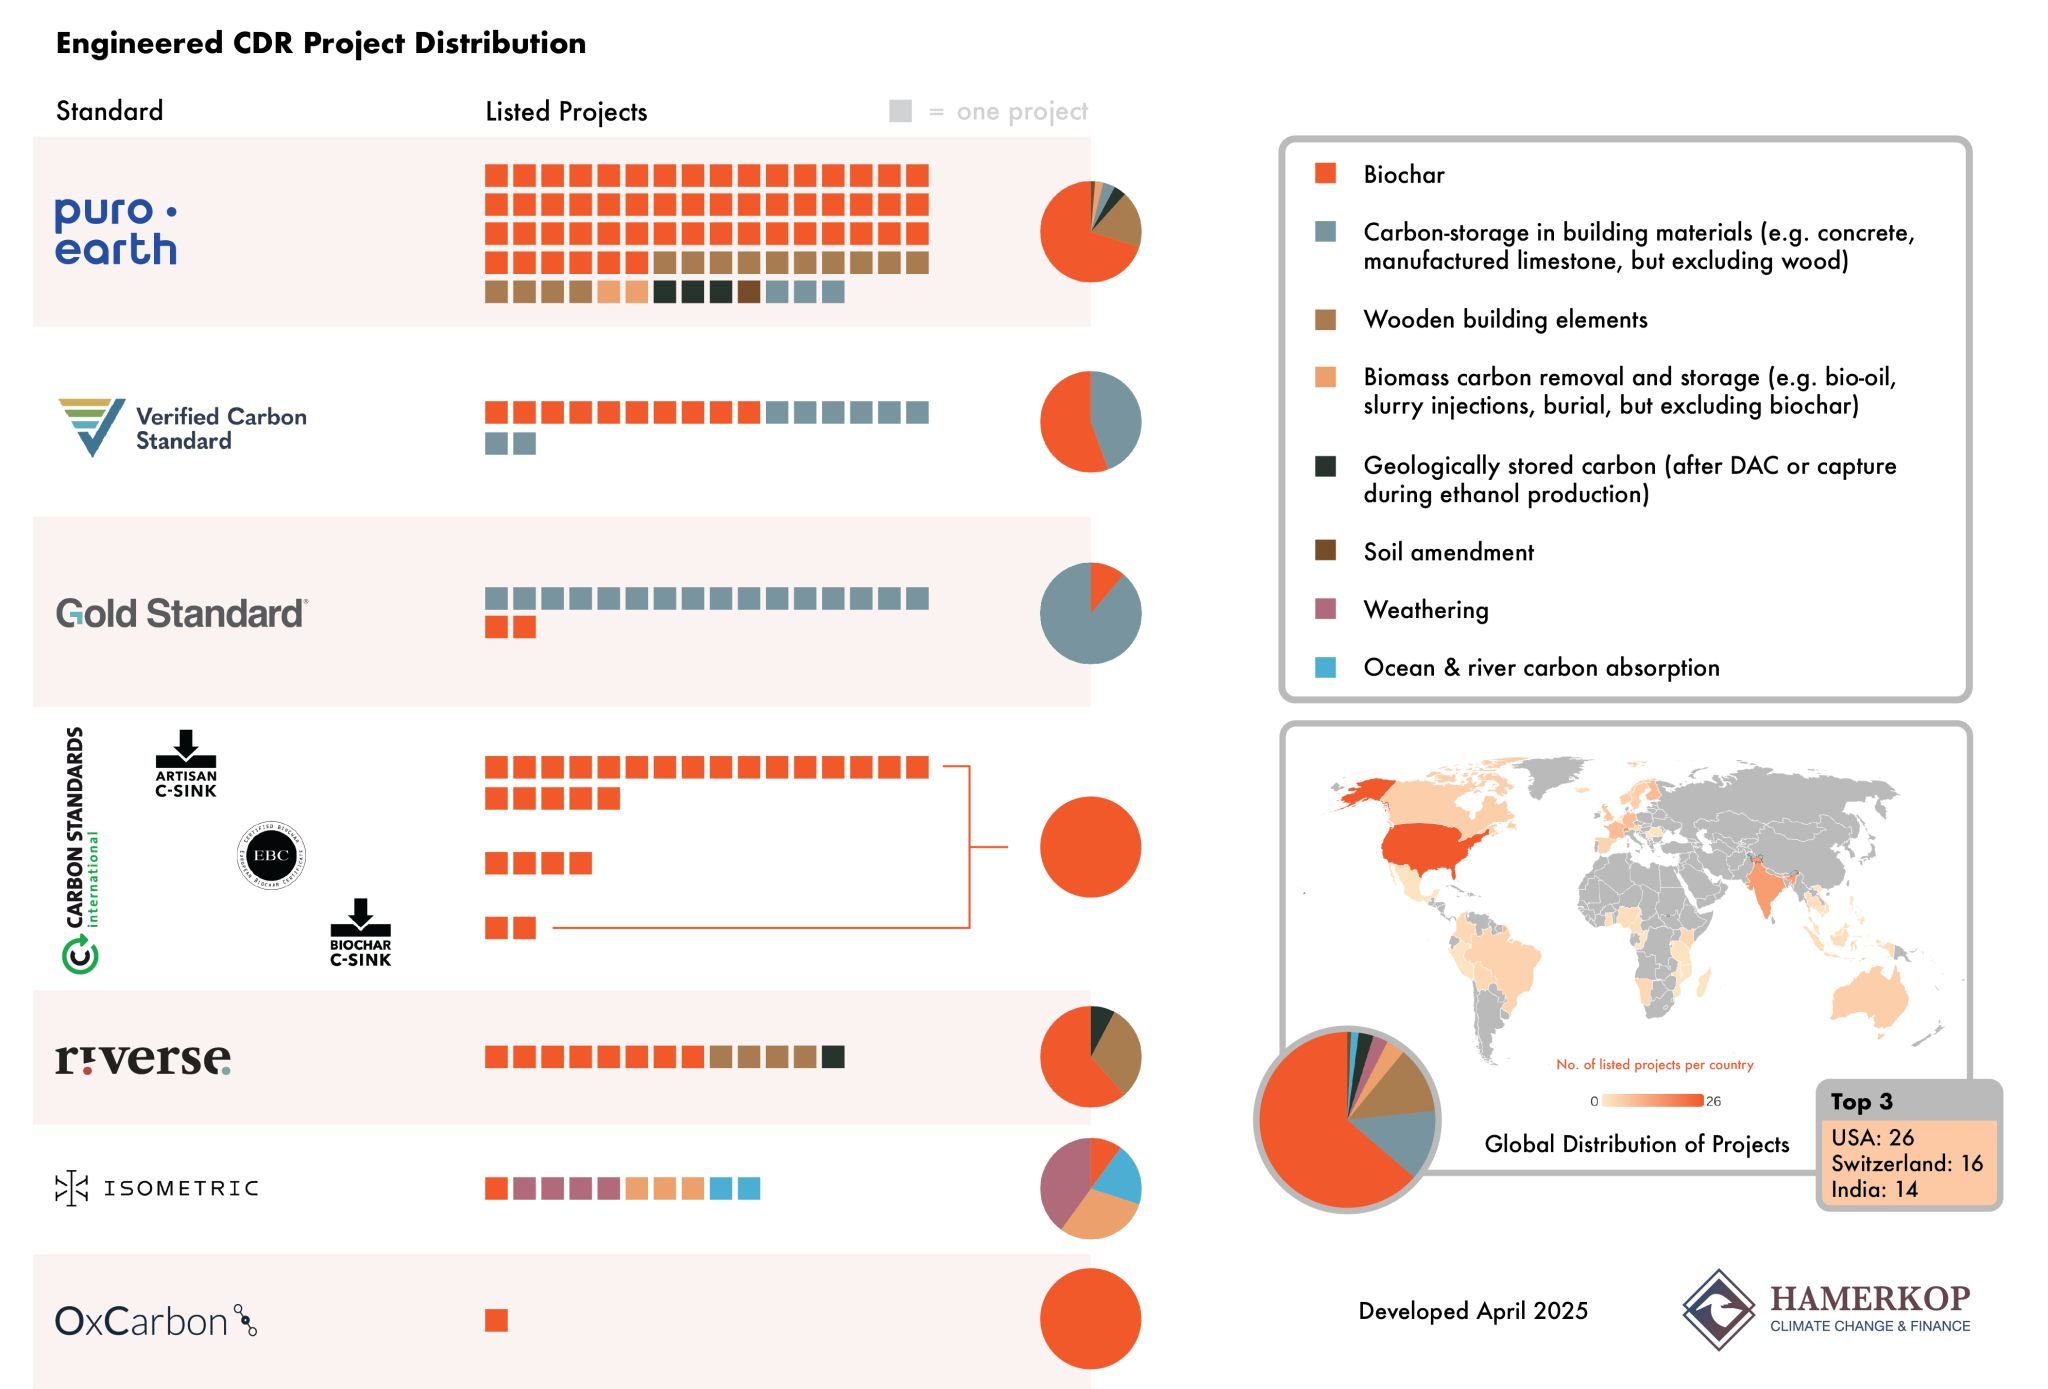
To assist decision-makers in navigating this landscape, we analyzed the usage and recognition of 13 certification standards for nature-based solutions (NbS) across five countries: Indonesia, Malaysia, Thailand, Cambodia, and The Philippines, based on each one’s policy/strategy and NDC targets. These countries were selected for their demonstrated willingness to tap into the carbon market and their potential to host a diverse range of NbS projects: afforestation, reforestation and revegetation (ARR), Reducing Emissions from Deforestation and forest Degradation (REDD+), improved forest management (IFM), and wetland restoration. The following certification standards were selected as the most relevant to NbS and to the region: 

  1. Verified Carbon Standard (VCS) 

  2. Gold Standard (GS) 

  3. Plan Vivo 

  4. Equitable Earth 

  5. Architecture for REDD+ Transactions - The REDD+ Environmental Excellence Standard (ART-TREES) 

  6. Cercarbono 

  7. Isometric 

  8. Biocarbon Standard 

  9. Global Carbon Council (GCC) 

  10. International Carbon Registry 

  11. OxCarbon 

  12. Social Carbon 

  13. Article 6.4’s Paris Agreement Crediting Mechanism (PACM) 
     

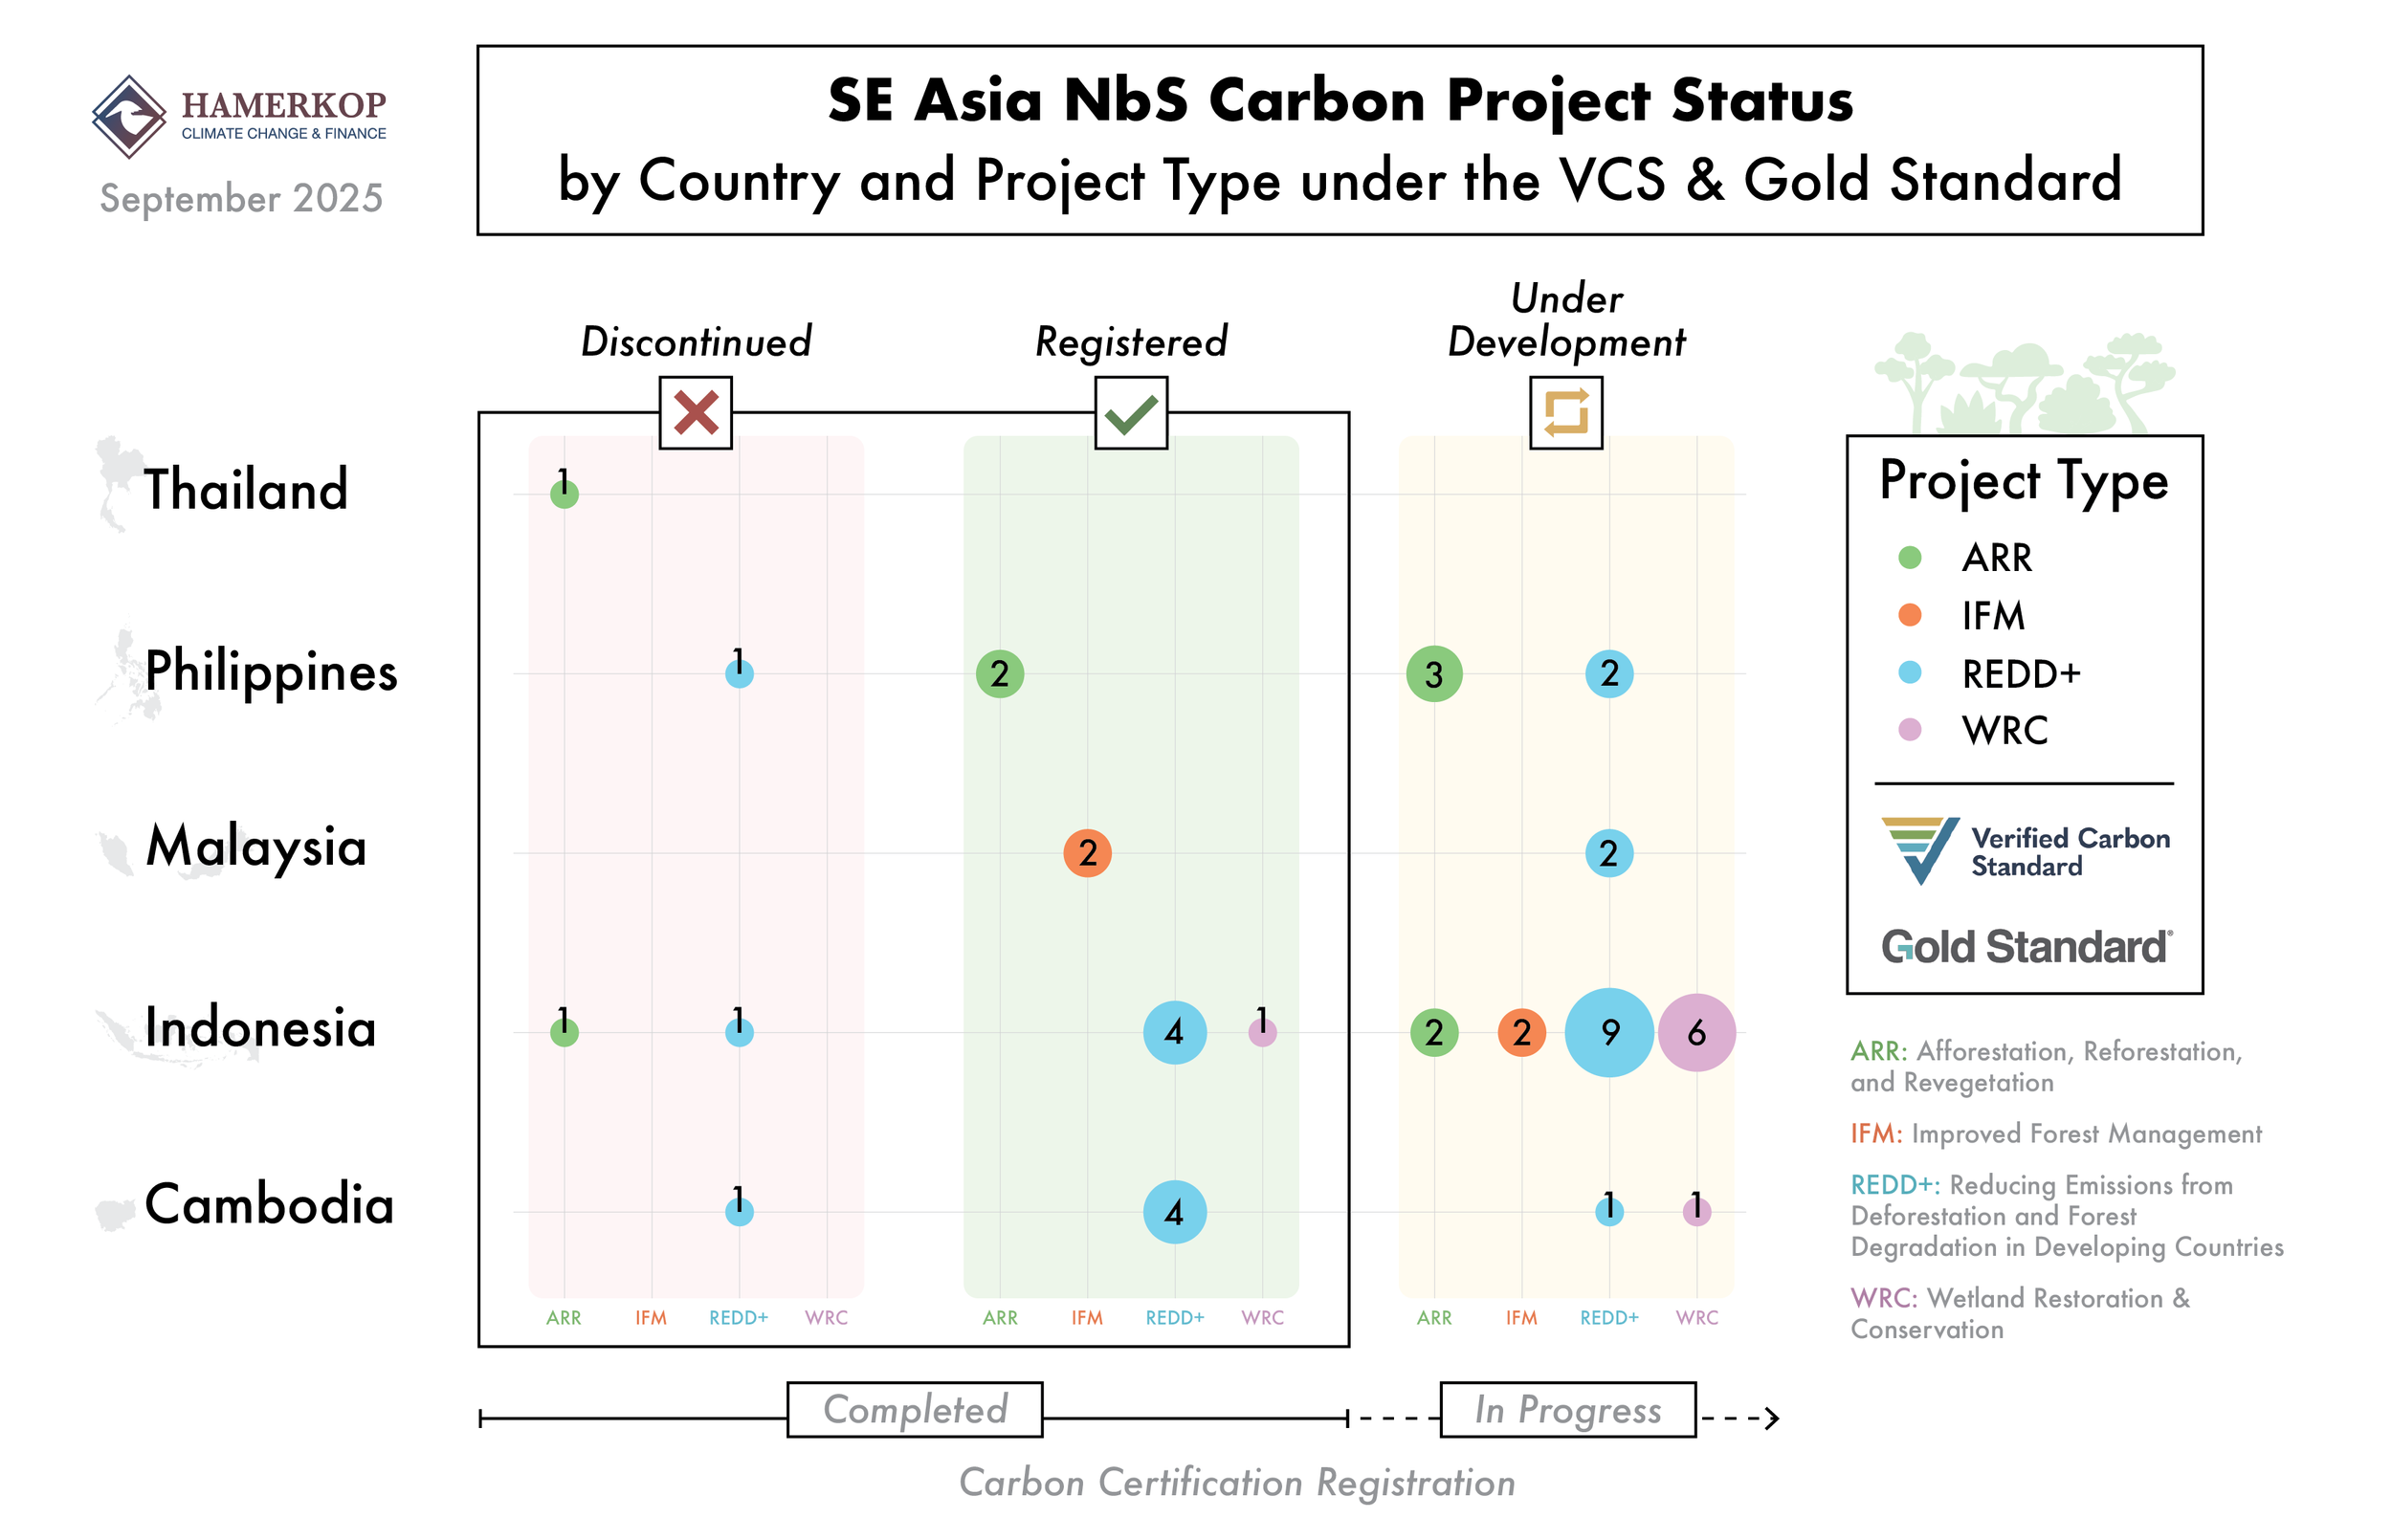
To gain an overall understanding of the landscape of NbS policy/strategies in these countries, we first looked at a country-by-country snapshot (as of September 2025) of how the carbon certification standards are recognized and used for NbS across the five Southeast Asian markets, as seen in the infographic in Figure 1.   


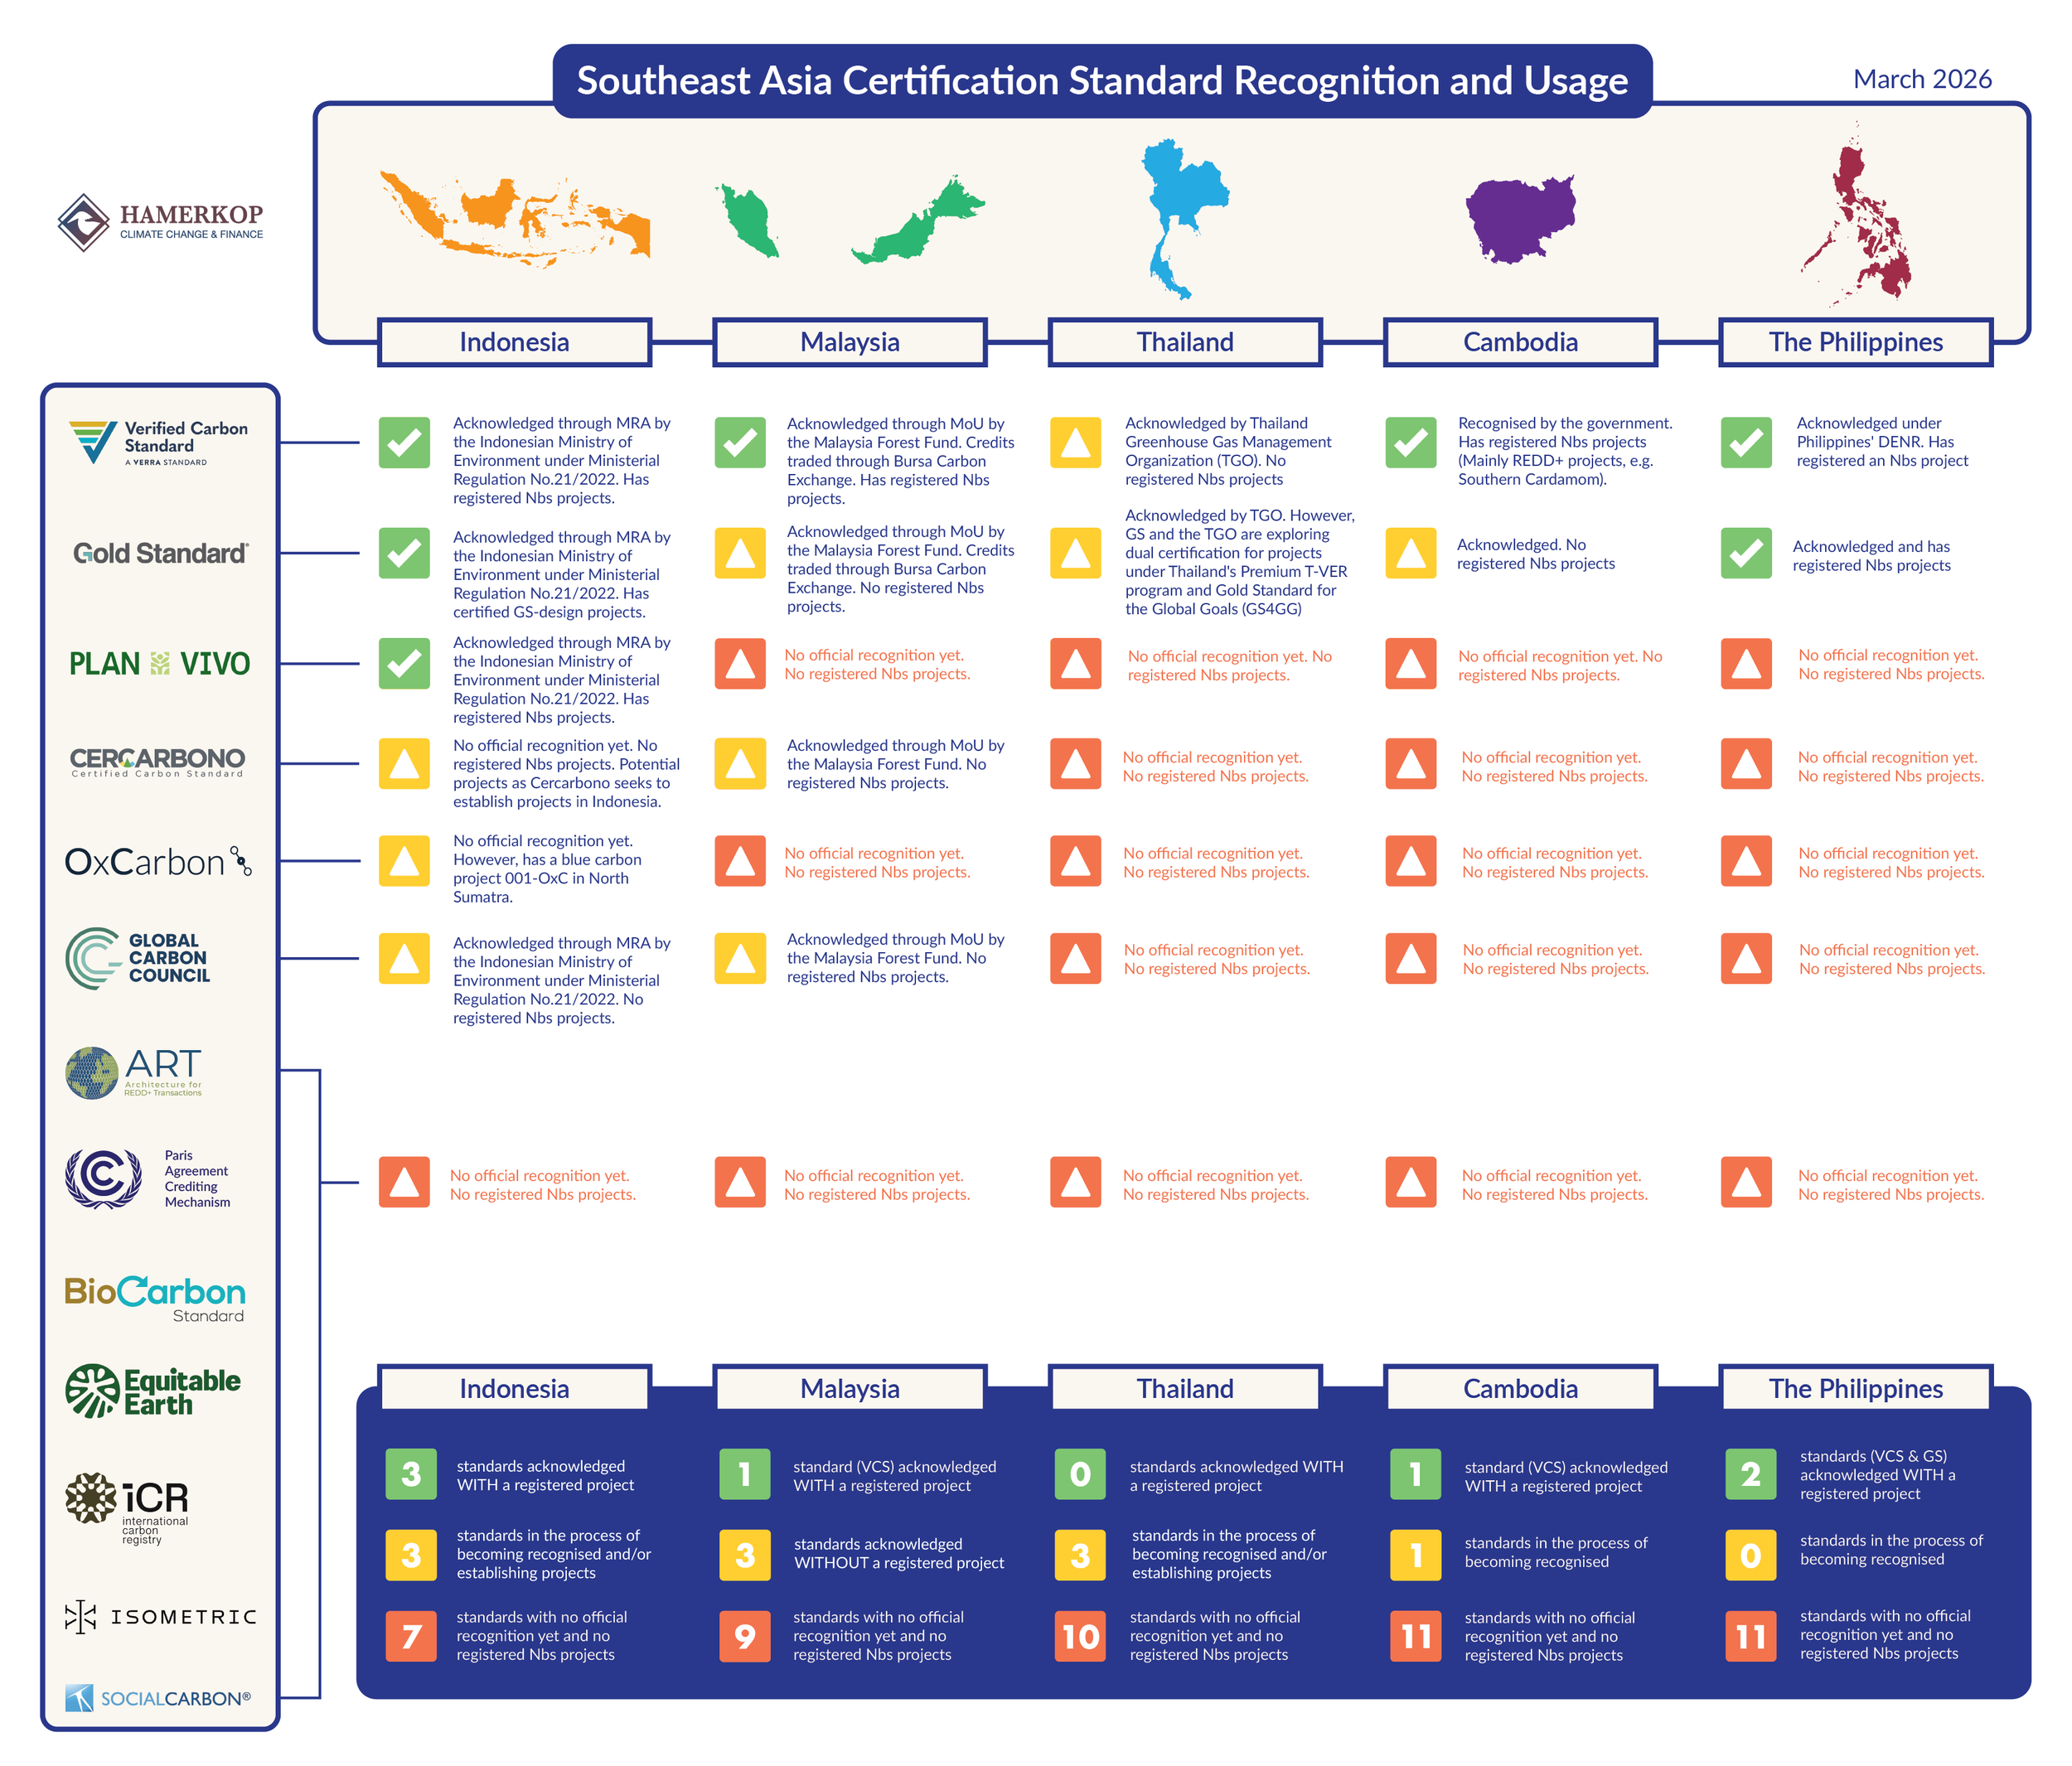
Figure 1 - Southeast Asia Certification Standard Recognition and Usage


Note: The infographic reflects the status of certification standards as of September 2025. Since then, the regional landscape has evolved rapidly. However, the accompanying text has been updated to incorporate the latest developments.   

Each row lists a standard, and each column shows that standard’s status in each country, whether it has official acknowledgement/policy alignment and, crucially, whether there are actual registered NbS projects on the ground. In short, it pairs policy acceptance with real deployment. Recognition currently outpaces implementation as many standards are acknowledged by governments but have no registered NbS projects yet. Actual activity clusters around a small set of widely used programs (notably VCS and, for non-REDD+ projects, Gold Standard), while newer or niche standards (e.g., Equitable Earth, Cercarbono, Isometric, ICR, OxCarbon, Social Carbon, BioCarbon) are present but largely await their first projects in most countries. The suitability of certification standards were assessed based on their: 

  • Alignment with existing policies/strategies: here defined as any officially written document by government authorities that support or restrict the promotion of NbS related activities and the use of certain certification standards in the country. This also accounts for any ongoing official recognition of a certification standard by government authorities. The current use of a certification standard in a country was assessed as a sign of unofficial endorsement in that context. 

  • Alignment with NDC priorities: notably how well certification standards are adapted to NbS project types prioritized by the country. For example, if Indonesia’s NDC prioritizes REDD+ projects, then certification standards with REDD+ methodologies were considered more suitable than those without such methodologies. 

The current analysis did not consider technical details such as monitoring, reporting and verification (MRV), benefit-sharing, or environmental and social safeguards requirements. In cases where the NDC does not show NbS priorities, the most common project type on the ground was considered as the priority project type. 

Based on this approach, we mapped each region’s landscape of policy/strategy and NDC targets to highlight how certification standards may align and where gaps remain: 

  1. Indonesia 

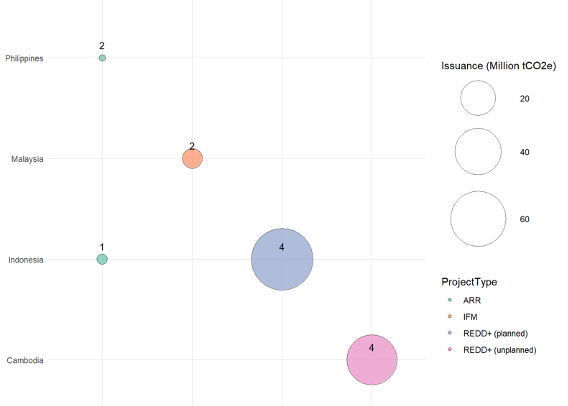
    The foundation of the VCM is the Presidential Regulation No. 98 of 2021, which defines the Carbon Economic Value (NEK) and introduces key mechanisms such as carbon trading, result-based payments, and a potential carbon tax. The regulation identifies the forestry and land use sector as the primary source of potential for emission reductions, with nearly 60% of Indonesia’s NDC targets expected to be met through restoring 2 million hectares of peatlands and rehabilitating 12 million hectares of degraded land under the FOLU Net Sink 2030 initiative. To operationalize this framework, the government issued a procedure for carbon trading in 2022, outlining the procedures for carbon trading and the certification of emission reductions through the SRN-PPI registry. This was followed by a regulation in 2023, providing sector-specific guidance for carbon trading in forestry, including MRV processes and the issuance of verified emission reduction certificates (SPE-GRK). In 2023, Indonesia also passed a law classifying carbon units as financial securities and mandated the creation of a carbon exchange, under the IDX Carbon platform. Indonesia has also signed Mutual Recognition Agreements with the GS, the VCS, Plan Vivo and GCC, allowing the projects certified under these standards to be registered to the SRN-PPI, without duplication of process, streamlining registration and oversight. Indonesia’s carbon projects are dominated by REDD+, which accounts for approximately 80% of activities, followed by afforestation/reforestation and wetland restoration.  

  2. Malaysia 

    Malaysia’s carbon market policy landscape is still under development. Two key documents, the National Guidance on Voluntary Carbon Market Mechanisms and the National Guidance on Forest Carbon Market are both non‑binding frameworks meant to steer the operation of voluntary carbon trading and forest‑based carbon activities. The first outlines how entities can voluntarily buy and sell credits to offset emissions; the second gives reference points for any state or organization planning forest carbon projects. Launched in 2022, the trading platform for carbon credits is the Bursa Carbon Exchange (BCX), operated by Bursa Malaysia, as a joint push by the finance and environment ministries to support net‑zero goals. BCX currently only promotes credits certified under Verra’s VCS or the Gold Standard. Participation is voluntary, and an ETS or carbon tax is still under development. Malaysia’s latest NDC does not make room to engage in Article 6 voluntary cooperation. Because land and forests fall under state control, state governments decide whether to allow carbon projects, making federal-state coordination essential for nature‑based initiatives. States like Sarawak and Sabah already have (or are developing) their own jurisdictional rules. 

  3. Thailand 

    Thailand’s 20‑year National Strategy and the 13th National Economic and Social Development Plan set the policy direction for the economy and development, including the country’s climate goals. These plans influence how carbon market mechanisms are integrated into national priorities, such as the development of the Thailand Voluntary Emission Reduction (T‑VER) program and its premium T‑VER credits, which offer higher-value offsets with additional environmental and social co-benefits. Alongside the T-VER, Thailand also launched the Voluntary Emissions Trading Scheme (V-ETS) in 2013, mostly covering renewable energy, efficiency, and waste; a national ETS is planned to take place once the Climate Change Act is passed (around 2028-29). Thailand’s energy and climate planning relies on national strategy documents and sector-specific plans. While the country updated its energy targets in 2018, these have not yet been formally adopted into the overarching national blueprint, so they continue to serve as the most relevant reference point for ongoing policy discussions. Thailand has committed to carbon neutrality by 2050 and to net‑zero by 2065, but these are not yet legally adopted and are expected to be embedded in the forthcoming Climate Change Act, alongside a developing national registry. As it stands, Thailand does not yet have concrete policies that specifically support or prioritize NbS. Instead, its current strategies remain heavily focused on the energy sector.  


  4. Cambodia 

    Cambodia’s Climate Change Strategic Plan 2024-2033 (CCSP) is the country’s blueprint for achieving its NDC and the roadmap that identifies objectives for each sector, setting adaptation and mitigation priorities. The CCSP complements the Long-Term Strategy for Carbon Neutrality which serves as a vision document for carbon neutrality in 2050. The Royal Government of Cambodia in the NDC, strongly supports REDD+ and has adopted the National REDD+ Strategy, aiming to cut annual deforestation by half from the 2006–2014 average rate of 1.5% per year. However, Cambodia does not currently have a national carbon credit registry, ETS or carbon tax, but is currently progressing towards the creation of a Sub-Decree, that will likely require carbon crediting initiatives to register with the national carbon credit registry that will soon be operational and released publicly. The Ministry of Environment has approved an “Operations Manual” for implementing Article 6 of the Paris Agreement which provides a framework for issuing and transferring ITMOs, although it has not been legislated yet. Cambodia is now piloting an early stage nested REDD+ system with the Jurisdictional & Nested REDD+ (JNR) methodology from VCS, which will let the government set an overall baseline for emissions and then give each REDD+ project its share of that baseline. The system is guided by draft rules (Prakas) and clear instructions for how projects should fit into it, covering elements such as project eligibility, MRV, safeguards, registry rules, and fair benefit-sharing. Cambodia introduces a draft list of the methods that projects can follow and get approved, featuring VCS JNR and standalone VCS REDD+ methodologies.  


  5. The Philippines 

    The carbon market landscape in The Philippines is not fully operational, with key policies and frameworks still being developed. The Department of Environment and Natural Resources, Climate Change Commission, and Department of Finance are actively working on essential components, including a national carbon registry, MRV infrastructure and process, sector-specific benchmarks, and social and environmental safeguards. A comprehensive policy framework is expected by late 2025, with the system becoming fully operational by February 2026. At present, policy development is more advanced in the energy sector—regulated under the Philippine Energy Plan 2020–2040—given its higher emission levels, while forestry sector guidelines are still being formulated. Uncertainty remains around forest emissions data and for instance, in 1994 emissions were nearly zero, but by 2000 forests appeared to absorb 105 MtCO₂ per year, a figure that dropped to 37 MtCO₂e per year by 2010. These shifts largely stem from evolving forest definitions and improvements in data methodology, indicating reliability issues with past estimates. Forestry targets are scarcely mentioned in the country’s NDC, without further measurable actions, making the energy sector a focus, with no progress on REDD+ readiness. The NDC targets also exclude the Land Use, Land-Use Change, and Forestry sectors. However, there are several ARR and upcoming REDD+ projects, primarily under the VCS and GS. 

The Southeast Asian carbon market is diversifying and operationally becoming nuanced. Success for businesses and stakeholders lies in understanding not just the technical requirements of a certification standard, but its political and regulatory compatibility with the host country’s specific climate strategy. 

Hamerkop team
Carbon Finance for NbS in Southeast Asia: Costs and Investment Opportunities in 5 Key Countries
 

Background 

Nature-based Solutions (NbS) are increasingly valued in the global carbon market as cost-effective climate change mitigation measures, supporting livelihoods, biodiversity and climate change adaptation. In 2024, an estimated 37 million NbS credits were transacted, accounting for 43.8% of voluntary market trading volume [1]. Compliance markets such as Singapore’s carbon tax and CORSIA are also opening to NbS credits, expanding potential demand. Singapore’s recent Request for Proposal to procure NbS credits further reinforces institutional demand. 

Building on this momentum, this report examines NbS carbon credit supply and cost potential in Indonesia, Malaysia, Thailand, Cambodia, and the Philippines—countries accounting for over 99.5% of Southeast Asia’s issuance of such credits and representing the region’s diverse and evolving NbS landscape. 

In Southeast Asia, terrestrial forests were lost at a rate of 0.59% annually, with 1.45 million hectares lost from 2000 to 2010 [2], and mangrove forests were also depleted at an average rate of 0.18% annually, with over 100,000 hectares removed from 2000 to 2012 [3]. These losses underscore both the urgency and opportunity for restoration, with the region’s carbon-rich tropical climate enhancing its suitability for NbS projects [4]. Across Southeast Asia, 121 million hectares of terrestrial reforestation potential (~3.4 GtCO₂e/yr) [4] and 0.5 million hectares of mangrove restoration potential (~0.2 GtCO₂e/yr) [5] highlight the region’s strong long-term NbS prospects. 

Terrestrial and coastal forest restoration are not only high-potential solutions but also market-preferred, yet their current supply remains limited, leaving considerable room for growth [6, 7]. This analysis assesses their cost and sequestration performance to identify early-stage investment opportunities in tropical terrestrial forests and coastal mangroves. 

Cost and Market Dynamics of Reforestation and Blue Carbon NbS 

Table 1 - Comparative overview of indicative cost and mitigation metrics for on-land and mangrove-based NbS projects across 5 countries 


The total project cost range (10-37 million USD) reflects typical total investment requirements per project, modeled for a 5,000-hectare, 40-year implementation across five study countries in Southeast Asia, while unit costs (USD 2,000-7,400/ha) represent average project-level expenditures. The average carbon sequestration rates of 10 and 20 tCO₂ per hectare per year are modeled assumptions consistent with published estimates for tropical reforestation and mangrove systems [8] in Southeast Asia. 

The broad national potential ranges (3.96-149.37 MtCO₂/year for on-land reforestation and 0.02-2.25 MtCO₂/year for mangroves) illustrate the variation in biophysical and land availability conditions among countries. Together, these figures highlight the trade-offs between cost, efficiency, and scalability across different NbS pathways. 

While both on-land reforestation (terrestrial forest) and blue carbon (coastal mangrove forest) projects offer strong mitigation potential, their cost structures, scalability, and geographical constraints differ. On-land reforestation generally requires lower investment per hectare (2,000-2700 USD/ha) making it more feasible in resource-constrained contexts, while mangrove restoration is often higher (4,900-7,400 USD/ha) affected by site-specific hydrology, ecological engineering needs, and elevated failure risks [9]. 

Despite these differences, both remain underrepresented in Southeast Asia’s carbon market. In Indonesia, on-land reforestation projects are listed but have not yet issued credits despite an estimated 149 MtCO₂ per year potential; in the Philippines, the MinTrees project has delivered 12,685 credits despite a national 36 million tCO₂/year potential. For mangrove restoration, Indonesia’s 2.25 million tCO₂/year potential contrasts with the 397,071 credits issued to date. These wide gaps between issuance and potential illustrate the underrepresentation of NbS pathways and highlight the significant scope for scaling them up. 

Unlocking NbS Potential in Southeast Asia: Country-Level Insights  


Figure 1 - Comparative costs, carbon efficiency, and national potential of reforestation projects in Southeast Asia. 


Figure 2 - Comparative costs, carbon efficiency, and national potential of mangrove restoration projects in Southeast Asia. 


Detailed assumptions on cost structure, project scale, and carbon price modeling are provided in the Methodology and Modelling Assumptions section below. As in figures above, reforestation and blue carbon projects exhibit wide variation in costs, returns, and mitigation potential across countries. These differences are not only technical but also interact with broader market and policy conditions, where stable policy frameworks, credible registries, and institutional capacity will ultimately shape how such potential can be translated into actual supply and opportunities realized. 

Indonesia 

Indonesia combines mature NbS systems with high removal potential: 149 MtCO₂/year from on-land reforestation and 2.25 MtCO₂/year from mangroves restoration. It leads the region in international-standard credit issuance, driven by REDD+ and mangrove restoration, and is expanding into ARR (Afforestation, Reforestation, and Revegetation). This is underpinned by a slightly more mature ecosystem, a domestic system (i.e., Sistem Registri Nasional), and positive market uptake from corporate buyers. Stronger registry flexibility and Mutual Recognition Agreements (MRAs) with international standards including Verra, which enables cross-recognition of verified credits, would further boost transactions. 

Philippines 

The Philippines has limited reforestation experience through the MinTrees project, which has issued the first batch of ARR credits in the country with a high market uptake (e.g., 78.5% retirement rate by April 2025). With moderate on-land reforestation average carbon abatement costs (USD 7.67/tCO₂), it has two registered and three developing projects. The country is gearing up to realise its 36.62 MtCO₂/year reforestation potential. The NBCAP (National Blue Carbon Action Project) targets 5,000 ha of mangrove restoration and explores JCM (Joint Crediting Mechanism) credits with Japan [10]. 

Thailand 

Thailand’s NbS activity remains domestically focused under the T-VER (Thailand Voluntary Emission Reduction) program, which has issued 587,000 forestry and agriculture credits. Ongoing projects are expected to issue 1.23 million tCO₂ per year, but the absence of international registry linkages limits buyer diversity. Closer alignment with international standards could expand buyer access and market potential. 

Malaysia 

Malaysia is exploring mangrove restoration alongside its past Improved Forest Management (IFM) experience. Institutional capacity is growing, with the Bursa Carbon Exchange operational and a domestic market-based crediting framework (e.g. Forest Carbon Offset) under development. Blue carbon project development is emerging through stakeholder engagement for a Sarawak Mangrove Restoration [11], contributing to Malaysia’s broader blue carbon annual mitigation potential of 180,000 tCO₂. 

Cambodia 

Cambodia’s current issuance is REDD+ focused, with one mangrove project under development. While on-land reforestation annual potential is limited to 3.96 million tCO₂, it has the lowest reforestation cost (USD 2,066 per ha) among the five countries, offering value for cost-sensitive investors. Stronger policies and registry systems would enhance market confidence. 

Methodology and Modelling Assumptions 

The costs of NbS projects assessed in this study fall into five key categories: pre-implementation costs (site selection, feasibility studies, PDD preparation), implementation costs (planting, fencing, seedling supply, infrastructure), management costs (coordination, administration, carbon asset management, consultations), MRV costs (field measurements, remote sensing, verification), and transaction and certification costs (validation, registry fees, insurance). The cost assessment takes into consideration the full project life cycle and recognises that expenses are not evenly distributed over time. 

Data on project costs, carbon sequestration rates, and mitigation potential were compiled from Verra-registered PDDs, peer-reviewed studies, and industry reports. The dataset was screened for quality and comparability, and was used to parameterise a cost-modelling framework for project- and country-level estimation. Key assumptions were refined through expert consultation to ensure consistency and realism. 

In modelling, both on-land reforestation and individual mangrove restoration projects were assumed to cover a total area of 5,000 ha over a 40-year crediting period under a 7% discount rate. For Reforestation, the project used active forest plantation with a sequestration rate of 10 tCO₂/ha/year and a carbon price of 25 USD/credit (reflecting risk buffer deductions). For mangrove restoration, the project followed an active planting–based reforestation with a sequestration rate of 20 tCO₂/ha/year and a carbon price of 28 USD/credit (reflecting risk buffer deductions). 


References:

[1] Ecosystem Marketplace, State of the voluntary carbon market 2025, F.T. Association., Editor. 2025. 

[2] Stibig, H.-J., et al., Change in tropical forest cover of Southeast Asia from 1990 to 2010. Biogeosciences, 2014. 11(2): p. 247-258. 

[3] Richards, D.R. and D.A. Friess, Rates and drivers of mangrove deforestation in Southeast Asia, 2000–2012. Proceedings of the National Academy of Sciences, 2016. 113(2): p. 344-349. 

[4] Zeng, Y., et al., Economic and social constraints on reforestation for climate mitigation in Southeast Asia. Nature Climate Change, 2020. 10(9): p. 842-844. 

[5] Alliance, G.M., The State of the World’s Mangroves 2024. 2024, Global Mangrove Alliance. 

[6] Friess, D.A., et al., Capitalizing on the global financial interest in blue carbon. PLoS Climate, 2022. 1(8): p. e0000061. 

[7] S, S. ARR Carbon Credits: The Next Gold Rush Backed by Google and Microsoft. 2025; Available from: https://carboncredits.com/arr-carbon-credits-the-next-gold-rush-backed-by-google-and-microsoft/

[8] Jiang, Y., et al., Restoring mangroves lost by aquaculture offers large blue carbon benefits. One Earth, 2025. 8(1). 

[9] Bayraktarov, E., et al., The cost and feasibility of marine coastal restoration. Ecological applications, 2016. 26(4): p. 1055-1074. 

[10] World Economic Forum. The Philippines kicks-off pioneering National Blue Carbon Action Partnership. 2025; Available from: https://www.weforum.org/friends-of-ocean-action/the-philippines-kicks-off-pioneering-national-blue-carbon-action-partnership/#:~:text=The%20Philippines%20first%20announced%20joining,both%20people%20and%20the%20planet). 

[11] Borneo Post. Sarawak launches first Blue Carbon Project in Tanjung Manis to restore 10,232 ha of mangroves. 2025; Available from: https://www.theborneopost.com/2025/03/20/sarawak-launches-first-blue-carbon-project-in-tanjung-manis-to-restore-10232-ha-of-mangroves/

Hamerkop team
NbS Carbon Credit Supply in Southeast Asia: Market Structure and Trends in 5 Key Countries
 

Summary

This article presents a landscape market analysis of nature-based solution (NbS) carbon credit supply across 5 Southeast Asian (SEA) countries: Indonesia, Malaysia, Cambodia, Thailand, and The Philippines (as of April 2025) [Footnote 1].  

The focus is primarily on carbon credits issued under international standards including the Verified Carbon Standard (VCS) and the Gold Standard (GS), as well as domestic standards such as Thailand Voluntary Emission Reduction Program (T-VER). Altogether, they represent the dominant certification systems in the regional voluntary carbon market (VCM): 

  • 5 SEA countries have contributed a total of 129 million Verified Emission Reduction (VER), with 33.72% (43 million credits) remaining unretired. The main contributors are Indonesia (59.3%) and Cambodia (37.0%), both primarily focused on REDD+ projects. 

  • Indonesian projects have not issued credits since 2022 amid regulatory changes, though recent progress with major standards signal towards the reopening of international issuance. 

  • Unretired older vintages in Cambodia and Indonesia may face declining market value, while Cambodian projects demonstrate an active supply with more recent vintages. 

  • Indonesia exhibits stronger market uptake than Cambodia, with a retirement rate of 82.3% and larger issuance volumes of 76 million credits.  

  • Across all 5 countries analysed, removals show 12% higher retirement rates than avoidance-only credits. 

  • 28 projects are currently under development, in addition to 13 already registered, suggesting a promising pipeline for future issuance. 

  • T-VER projects represent a strong future supply source, with 1.2 million VERs expected annually from forestry and agriculture projects, despite currently limited issuance under the GS or the VCS.


Section 1: Supply Overview

Figure 1 - Trends in cumulative carbon credit supply, retirement, and retirement rate on the VCM (2011–2025) across 5 SEA countries

From 2016 to 2023, VERs issuance in the 5 countries has grown steadily with rapid acceleration since 2019 (Figure 1). Growth has slowed since then, notably due to the moratorium in Indonesia, which has been lifted as of mid-October 2025 [1]. Meanwhile, retirement rates rose from below 20% (of overall supply) in the late 2010s to over 65% by 2025, indicating stronger market uptake and improved liquidity. 


Figure 2 - Total and non-retired carbon credit supply by country (million tCO2)

Supply by Location and Project-Type 

As of April 2025, the 5 SEA countries [Footnote 2] had issued 129 million VERs, with Indonesia (59.3%) and Cambodia (37%) accounting for the vast majority, positioning them as the region’s key contributors to the VCM.  

Unretired credits, making up the active supply, account for 43 million VERs, with projects in Cambodia (28 million) and Indonesia (13 million) forming the bulk of that.  

Figure 3 - Distribution of registered carbon credit projects by country and type

Nearly 96% of issued NbS VERs are generated by REDD+ projects [Footnote 3] (Figure 3), primarily in Cambodia and Indonesia. They are typically large-scale and offer high credit yields. Compared to the global overall net forest loss rate of 0.12% per year, Cambodia and Indonesia experienced significantly higher rates of 2.68% and 0.78% during 2010–2020 [2]. The high deforestation rates underscore the urgency of deploying REDD+ interventions, which both countries have prioritised within their NDCs and forest policies. 

However, Indonesia and Cambodia differ in the types of REDD+ projects registered. In Indonesia, they are primarily related to avoided planned deforestation, authorised through formal land-use change permits, while those in Cambodia are related to avoided unplanned deforestation tackling informal or illegal forest loss. This likely reflects the dominance of informal drivers (such as unauthorised encroachment and logging) [3] and weaker enforcement capacity in Cambodia’s forest sector [4]. In Cambodia, government-supported projects prioritise illegal forest loss. 

Compared to Cambodia, Indonesia possesses a much larger forest area, allowing land-use concessions to be allocated to the private sector while still leaving extensive zones for protection that are not intended for logging. In contrast, Cambodia’s relatively limited forest extent, coupled with ongoing demand for forest conversion, means that concessions held by the government may extend into areas where logging is not legally permitted [4], contributing to the prevalence of illegal forest loss. 

Other NbS project types, including Improved Forest Management (IFM) and Afforestation, Reforestation, and Revegetation (ARR), are primarily found in Malaysia and The Philippines, with Indonesia also hosting one ARR project focused on wetland restoration. Together, these project types have contributed to less than 4% of the total supply. Beyond current supply, Malaysia’s 4.94 million ha of degraded land [5], Indonesia’s 24 million ha of degraded areas [6], and the Philippines’ 7.22 million ha of existing forest highlight substantial room to scale ARR and IFM [7].

Section 2: Credit Retirement Performance 

Carbon Credit Retirement [8, 9] 

Once a carbon credit is retired, it can no longer be traded or resold on the market. Retirement marks the point at which the credit is claimed for offsetting, contributing to overall climate change mitigation and avoiding double counting. Buyers can only claim their offsetting and positive impacts after retirement. 

Retirement Performance by Country

 Figure 4 - Cumulative retirement rate of carbon credits by country and project type

Retirement rates vary across countries, reflecting differences in issuance, utilization and market absorption [10]. However, high retirement rates do not always signal strong demand or quality—they may instead reflect issuance timing and scale. 

Figure 5 - Annual carbon credit issuance by country

Retirement rates naturally fluctuate with issuance cycles. After an issuance, credits are typically retired over several years, especially for larger projects—as seen in Malaysia between 2011 and 2016. When large new issuances occur (e.g., Malaysia 2023–2025), overall country-level retirement rates may temporarily decline due to a sudden increase in available supply. 

It is important to consider the issuance scale with retirement rates. In countries with low issuance volumes like Malaysia and the Philippines, even small retirements can result in high ratios. Although these countries show retirement rates of 68.3% and 78.5%, respectively, they together account for only 3.81% of total regional retirements. While these high rates may reflect strong market uptake, it is equally important to acknowledge that the market has absorbed a substantial volume of credits from major suppliers like Indonesia and Cambodia. 


Case Comparison: Indonesia vs Cambodia 

Indonesia’s credits appear to receive stronger market uptake than Cambodia’s in REDD+, as indicated by both retirement rates and issuance scale. As of April 2025, Indonesia’s cumulative retirement rate had reached 82.3%, significantly higher than Cambodia’s 40.4%. In absolute terms, Indonesia had issued over 76 million credits, compared to Cambodia’s 47 million. Despite this larger supply, Indonesia still maintains a higher retirement rate, suggesting relatively stronger credit absorption by the market.  

Several factors may help explain this difference. One is issuance timing: Indonesia’s last credit issuance occurred in 2022, giving the market more time to absorb the supply, whereas Cambodia continued issuing into 2023. Project quality and perception may also play a role. Indonesian REDD+ projects tend to receive higher ratings from carbon credit rating agencies [11], which draws stronger buying interest. In contrast, some Cambodian projects, such as the Southern Cardamom REDD+, have faced reputational challenges over reported rights violations [12], which could weaken buyer confidence. 

Retirement by Mitigation Type 


Figure 6 - Retirement rate (left) and overall supply (right) by mitigation type [Footnote 4].


Removal and mixed nature credits (such as IFM combining both avoided emissions and carbon removal) show better retirement performance, and lower supply. Removal credits have a higher retirement rate of 78%, followed by mixed (68%) and avoidance (66%) [Footnote 5], reflecting buyer preference in emissions offsetting, potentially sparked by reporting frameworks like the Science Based Targets initiative (SBTi), giving more importance to this type of credits for offsetting [13]. 

Section 3: Future Supply Potential and Thailand’s Domestic Supply 

Projects Pipeline Under VCS and GS 


Figure 7 - Status of NbS projects by country and type under Verra and Gold Standard


Across the 5 countries, a total of 46 projects have been established, with over 60% (28 projects) still under development. This signals a robust pipeline for future credit issuance, particularly in Indonesia, which alone hosts 19 projects under development and features a diversified mix of ARR, IFM, REDD+, and WRC (Wetland Restoration and Conservation) types, underscoring both its strong track record and forward-looking potential. Meanwhile, the Philippines shows a strong presence and potential growth in ARR, while both it and Malaysia are exploring REDD+ development. 

The signing of a Mutual Recognition Agreement (MRA) between Indonesia and the GS in May 2025, followed by Plan Vivo, Global Carbon Council and Verra are key signals of a policy normalization process. Yet, as of October 2025, there was no historical transaction of NbS VERs through the Indonesian domestic system (i.e., SPE-GRK). These moves are expected to unlock previously stalled projects and restore market confidence, potentially reviving issuance growth from 2025 onward. 

Thailand’s T-VER Supply


Figure 8 – Projects pipeline under T-VER System (forestry and agriculture sectors)


Thailand currently has no NbS projects registered under the VCS or the GS, and has developed its own VER program, operating since 2013. Under the forestry and agriculture sectors, it has issued 587,688 VERs from 18 projects (0.14 million tCO2e/year). However, these issuing projects collectively account for only 11% of the total estimated annual reduction across all 121 listed projects (1.23 million tCO2e/year), highlighting the scale of unrealised supply in the future. 

Looking ahead, 101 registered yet non-issuing projects are expected to generate around 1.08 million VERs annually once credits are issued. Altogether, the T-VER pipeline could supply approximately 1.23 million VERs per year to both domestic and international markets, suggesting significant untapped potential, with more credits likely to be released in the near future. 

Footnotes:

[1] The 5 countries analysed account for 99.5% of total NbS credit issuance in Southeast Asia, based on data from the Berkeley Database, covering credits issued under VCS and GS as of April 2025.

[2] Thailand is included in the overall analysis scope but is excluded from Sections 1 and 2 due to the absence of active NbS projects under international standard. Its domestic T-VER program is discussed separately in Section 3.

[3] Project types were adapted from original database, with refinements for analytical clarity. The only registered WRC project was classified as ARR based on its methodology. REDD+ projects were divided into planned and unplanned categories due to their dominant share of issuance and the specific circumstances of each project.

[4] Mitigation type classification follows the Berkeley Voluntary Offsetting Database, based on project methodologies.

[5] Reclassify the mitigation type from “reduction” to “avoidance”, aligning with NbS carbon effect typology.

References:

[1] Times, T.S. 2025  [cited 2025 November 17]; Available from: https://www.straitstimes.com/asia/se-asia/indonesia-allows-resumption-of-international-carbon-trade-after-four-years

[2] Sarre, A., Global forest resources assessment, 2020: Main report. 2020: Food and Agriculture Organization of the United Nations. 

[3] Ken, S., et al., Assessment of the local perceptions on the drivers of deforestation and forest degradation, agents of drivers, and appropriate activities in Cambodia. Sustainability, 2020. 12(23): p. 9987. 

[4] Trends, F., Timber Legality Risk Dashboard: Cambodia. 2022. 

[5] Malaysia, G.o., Malaysia national report to the United Nations Convention to Combat Desertification (2019 reporting year). 2019, United Nations Convention to Combat Desertification. 

[6] Indonesia, W.R.I. Good data could save two million hectares of degraded conservation areas. 2019  [cited 2025 November 18]; Available from: https://wri-indonesia.org/en/insights/good-data-could-save-two-million-hectares-degraded-conservation-areas

[7] Philippines, C.C.C. Keeping up with deforestations. 2024  [cited 2025 November 17]; Available from: https://climate.gov.ph/news/851

[8] Toucan. What are carbon credit retirements? 2023; Available from: https://blog.toucan.earth/carbon-credit-retirement/

[9] Wikipedia. Carbon retirement. n.d.; Available from: https://en.wikipedia.org/wiki/Carbon_retirement

[10] Sylvera, in Carbon Markets: 5 Key Takeaways for 2025 Strategies. 2024. 

[11] EcoAct. Katingan Mentaya Project achieves AA rating from BeZero Carbon. 2024; Available from: https://www.linkedin.com/posts/ecoactuk_climateaction-carbonmarkets-sustainability-activity-7303087248390914048-dOEo/

[12] Watch, H.R., Carbon Offsetting’s Casualties: Violations of Chong Indigenous People’s Rights in Cambodia’s Southern Cardamom REDD+ Project. 2024. 

[13] CarbonOffsetGuide. Using Carbon Credits: Issues and Considerations. n.d.; Available from: https://offsetguide.org/using-carbon-credits-issues-and-considerations/


Hamerkop team
The Most Comprehensive Carbon Certification Standards Mapping on the Market: 2024-25
 

Approximately 10 years ago, World Bank analysts predicted that by 2025 or 2030 regional carbon markets would merge into a large single and global market. This prediction was formulated in the context of compliance carbon markets forming up at the time in Europe, North America, Australia and elsewhere. While this has not materialised, and the compliance carbon markets are still operating at national or regional levels, the voluntary carbon market (VCM) is not growing any simpler. Although the VCM is more global, in its impact and dynamics, the increasing number of carbon certification schemes, has made it more complex. 

As explained in our carbon finance handbook, the role of most carbon certification standards is to perform three fundamental functions: 

  • Develop, approve, and update rules, principles, and requirements defining the conditions under which carbon credits can be delivered. 

  • Review carbon offset projects against these rules, principles and requirements. 

  • Operate a registry system that issues, transfers, and retires carbon credits. 

While the VCM had been operating with approximately 6 certification schemes for nearly 15 years (from 1996 to 2010), the recent years have seen the rise of numerous competing standards.  

Considering that 15 new carbon certification schemes have seen the light of day in 2023, as many as the three previous years combined, it is anticipated that the number of standards will keep growing, before eventually consolidating, as was the case with the merger of Gold Standard and CarbonFix, and to so some extent the VCS and Climate Community and Biodiversity Standard. 

Below you will find a range of infographics breaking down the complexity of certification standard schemes in different ways.


Our 2025 Carbon Certification Standard Infographics:

[Feel free to download and share]


65 Carbon Certification Standards? What is going on in the carbon market?!

Over a decade ago, World Bank analysts could not have been further from the truth when they predicted that by 2025-2030 regional carbon markets would merge into a single global market…

As we highlighted with our infographics last year, the fragmentation of certification schemes shows an increasingly complex picture! After reaching out to all of the certification schemes we could find, we have updated our database to feature the 65 Certification Schemes that we know are active in the world.

The high number of standards and rapid evolution of the space can be explained by several factors:

  • The need for specialised schemes within sectors: offering fewer and more focused tools, methodologies, with a range of simplifications

  • The need for culturally adapted schemes: not everyone works in English! Domestic or regional schemes can be rendered more accessible when available in the locally spoken languages (e.g., French, Spanish, Japanese, etc.)

  • The need for contextually adapted schemes: domestic or geographically specialised schemes can provide a range of default and locally relevant values that simplify the certification and verification processes

  • The need for more sovereignty: countries believe they should have control over how carbon credits are issued for domestic projects and carbon accounted for, as well as who these credits are issued to. Countries, often want to set aside some of the best practices in exchange for cost effectiveness.

  • The need for less resource-intensive processes: as the leading schemes grow in complexity to accommodate their stakeholder needs for integrity, this creates rooms for less sophisticated and/or more innovative schemes

We expect the number of schemes to keep growing over the years, followed by a consolidation of the competition with the weakest throwing in the towel. This process has already begun…


Carbon Certification Standards: a global perspective on emerging domestic trends

As the carbon market matures, carbon certification standards—frameworks ensuring that carbon credits represent real, measurable, and verifiable climate benefits—are increasingly at the forefront of discussions. While global standards like Verra's VCS and Gold Standard dominate the space, national and domestic standards are gaining traction.

But what exactly are these standards?

Here’s a rough definition: national or domestic carbon certification standards are country-specific frameworks designed to guide the development, registration, and issuance of carbon credits. These schemes often reflect national priorities, regulatory contexts, and alignment with international climate agreements. They are often run by government authorities, sometimes by affiliated organisations and are available in the local language.

From the west to the east: domestic schemes are emerging as targeted competitors to global standards. Initially taking place in Western countries, it is now taking place across Asia where J-Credits and Thai-VER are pioneers, and where Korea, Mongolia, Indonesia, and Malaysia have recently (or will soon) launch their own schemes.

Why this trend is emerging: governments are seeking greater control over carbon market revenues and ensuring alignment with Nationally Determined Contributions (NDCs). They aim to reduce reliance on international schemes and have schemes that are simpler and more cost-effective for project certification. Plus, Tailored standards allow for region-specific considerations, such as language, target sectors, and the use of tailored carbon accounting estimation

Potential evolution: the next decade could see a proliferation of domestic schemes, with more countries designing standards that align with Article 6 of the Paris Agreement and that could be used for 6.2 transactions, like in Premium T-VER in Thailand and JCM in Japan

Greater regional cooperation may lead to harmonized standards across economic blocs, facilitating cross-border carbon trading while maintaining high integrity, such as the efforts spearheaded by Singapore, Malaysia, Thailand and Indonesia


Over 5.3 BILLION carbon credits issued by 50 standards… but just TWO dominate the market. Why?

Let’s dive into some fascinating trends from the last 29 years of carbon credit certification:

The Top 2 standards rule the market:
The UN Climate Change's Clean Development Mechanism (CDM, 1997) and Verra’s VCS (2007) alone account for 70% of all issued credits. CDM leads with 45%, while VCS holds a 24% share. Combined, they’ve issued more credits than all other standards put together.

Gold Standard vs. VCS: a tale of two strategies
Though both launched around the same time, VCS has surged ahead. Why? A strategy focusing on REDD+ projects, large-scale renewables, and less conservative cookstove methodologies. Meanwhile, Gold Standard opted for a more conservative approach and refused to credit REDD+.

Geographic and sectoral specialization:
Standards like the ACR at Winrock International (American Carbon Registry), Climate Action Reserve, Australia’s ERF, and China’s CCER have focused on specific regions or sectors, issuing over 100M credits each.

The rise of REDD+ and the new players:
With a focus on REDD+ projects, standards like Architecture for REDD+ Transactions (ART), BioCarbon Standard, World Bank’s FCPF, COLCX & T-VER are growing rapidly. Emerging international and cross-sectoral standards like Cercarbono and Global Carbon Council have raised their profile significantly and are getting ready to take over the VCS and the GS.

What’s next?
A surprising number of standards (14!) have yet to issue their first credits, while others are still carving out their niche. Meanwhile, new domestic standards continue to emerge every year (check out our next infographics).

The rise of the new-wave standards

A new generation of standards is gaining traction and is scaling up rapidly (e.g., Isometric, Tero Carbon, Puro.earth, Isometric, ERS - Ecosystem Restoration Standard, Riverse, etc.)


Certification standard application scopes

In the constantly evolving world of carbon certification standards it can be difficult to understand the varying scopes… So we decided to break them down for you:

Here are 66 active carbon certification standards with insight into the realms in which they operate…

We highlighted the following categories:

  • Land Use, Land Use Change, and Forestry (ARR incl. agroforestry, agriculture, land restoration)

  • Conservation & REDD+ (incl. project & jurisdictional)

  • Carbon Dioxide Removal (incl. engineered carbon removal, biochar)

  • Industrial GHG emission reduction and energy efficiency

  • Methane Capture (incl. waste handling and disposal)

  • Renewable Energy

  • Domestic Energy Efficiency (incl. cookstoves, efficient lighting, water access, building energy efficiency)

As you can see on the last page, “Land Use, Land Use Change and Forestry” is the dominant scope, with 25% of the overall coverage by these 66 standards. The rest of the scopes range between 10-15% of the overall coverage.

[Link to our LinkedIn post about this infographic]


As of January 2025, here are the CORSIA-approved carbon certification standards…

Why do these standards matter? CORSIA is expected to become one the major sources of demand for carbon credits, and only a handful of eligible standards have met the (demanding) criteria… And the approval process is stringent.

Let’s back up a little bit: CORSIA = the Carbon Offsetting and Reduction Scheme for International Aviation.

CORSIA was established in 2016 by the UN’s International Civil Aviation Organization (ICAO) as a market-based mechanism to support carbon-neutral growth in the aviation industry. While participation is voluntary until 2027, flights between countries that have committed to align with CORSIA are required to comply… Meaning the airline operators that emit over 10,000 tonnes of CO2 per year must monitor, report, and purchase credits to offset some of their emissions. At this point, 126 countries have committed to the First Phase.

A month ago, the ICAO released a series of documents detailing revised eligibility and exclusion criteria for crediting programs as part of Phase 1 for CORSIA. The updated guidelines exclude project types like large-scale REDD+ credits (>7,000 per year), afforestation/reforestation, and renewable energy projects above 15 MW.

This will undoubtedly have a major impact on the VCM. As demand and competition increases for the subset of eligible projects, prices will sky-rocket, due to the limited eligible supply and the overlapping eligibility with other market segments. We are expecting this to send strong positive market signals in 2025.

The goal of all of this? Aligning with the Paris Agreement, pushing for higher integrity credits, and emphasizing integrity and transparency.


The state of (listed) engineered carbon dioxide removal projects

Carbon Dioxide Removal (CDR) is the process of capturing and storing carbon dioxide through natural interventions and/or technological processes. There are many ways to do this, and the methodologies are constantly evolving… Some of the most common types of engineered carbon removal listed on the registries included are:

  • the production of biochar,

  • carbon sequestration and long-term storage in building materials (like carbonated concrete aggregate),

  • biomass carbon removal and storage (e.g. bio-oil and slurry injections)

In our infographic, we broke down the categories of CDR based on the commonalities in project type across various standards and methodologies. As you can see, biochar dominates the sector. Nevertheless, more technological sequestration and storage methodologies are being developed across all registries.

Our takeaways:

  • CDR (including nature based and engineered) and avoidance of emissions both need to be done in tandem to limit emissions

  • Although nature based is generally cheaper, engineered has its own advantages such as being more readily available in the short term, being more durable, having greater scalability and featuring more location flexibility

  • Engineered CDR is constrained by costs, energy needs and potential land and climate impacts – relying too hard on engineered CDR could limit growth of other mitigation efforts

  • Biochar is the driver of the engineered carbon removals market, but other technologies are developing quickly (like DAC, ocean alkalinity, bioenergy with CCS and BECCS, enhanced weathering, ocean fertilisation)


Southeast Asia Focus


Southeast Asian Certification Standard Recognition and Usage

Southeast Asian countries are increasingly utilising Nature-based Solutions for climate mitigation

We analysed NbS including 𝗔𝗥𝗥, 𝗥𝗘𝗗𝗗+, 𝗜𝗙𝗠 and 𝗪𝗲𝘁𝗹𝗮𝗻𝗱 𝗥𝗲𝘀𝘁𝗼𝗿𝗮𝘁𝗶𝗼𝗻 across five Southeast Asian countries: Indonesia, Malaysia, Thailand, Cambodia, and The Philippines… And dove into 𝟭𝟯 𝗰𝗲𝗿𝘁𝗶𝗳𝗶𝗰𝗮𝘁𝗶𝗼𝗻 𝘀𝘁𝗮𝗻𝗱𝗮𝗿𝗱𝘀 to observe whether these countries have recognised and/or used these standards in building their NbS projects.

This helps us understand the current landscape of NbS and the larger national policies and strategies at play in the context of Southeast Asia…

Countries are increasingly shifting their national carbon markets and climate policies to utilise NbS and align with recognized certification standards.


Reforestation and Mangrove Restoration in SE Asia

Swipe through to see our two infographics documenting project costs, carbon sequestration costs, carbon margin profit, and potential for both 𝗥𝗲𝗳𝗼𝗿𝗲𝘀𝘁𝗮𝘁𝗶𝗼𝗻 and 𝗠𝗮𝗻𝗴𝗿𝗼𝘃𝗲 𝗥𝗲𝘀𝘁𝗼𝗿𝗮𝘁𝗶𝗼𝗻 projects in SE Asia

𝗞𝗲𝘆 𝗧𝗮𝗸𝗲𝗮𝘄𝗮𝘆𝘀:

𝗦𝘁𝗿𝗼𝗻𝗴 𝗠𝗮𝗿𝗸𝗲𝘁 𝗣𝗿𝗲𝘀𝗲𝗻𝗰𝗲: Indonesia and Cambodia supply ≈96% of NbS credits [mostly through REDD+ projects], while ARR and blue carbon remain underrepresented.

𝗖𝗼𝗺𝗽𝗲𝘁𝗶𝘁𝗶𝘃𝗲 𝗖𝗼𝘀𝘁𝘀 & 𝗣𝗿𝗼𝗳𝗶𝘁𝘀: Reforestation credits cost ~USD 7–9/tCO₂ vs. mangroves at USD 10–12/tCO₂, with profit margins of USD 15–20/tCO₂.

𝗛𝗶𝗴𝗵 𝗣𝗼𝘁𝗲𝗻𝘁𝗶𝗮𝗹: Indonesia leads with ~149 MtCO₂/year reforestation potential; blue carbon, though valuable, is geographically constrained.

𝗣𝗶𝗽𝗲𝗹𝗶𝗻𝗲 𝗠𝗼𝗺𝗲𝗻𝘁𝘂𝗺: 28 projects are in development under Verra/Gold Standard, while Thailand’s T-VER program is expected to generate >1.2 MtCO₂/year domestically.

𝗕𝗿𝗼𝗮𝗱𝗲𝗿 𝗜𝗺𝗽𝗮𝗰𝘁: NbS projects deliver biodiversity, coastal protection, and water-quality co-benefits.


The Suitability Landscape and Recommendations for Carbon Standards in the Nature-based Solutions Sector

We analysed the national priorities, planning documents, platforms for carbon trading, and more to figure out the state of 𝗰𝗮𝗿𝗯𝗼𝗻 𝘀𝘁𝗮𝗻𝗱𝗮𝗿𝗱𝘀 for 𝗡𝗮𝘁𝘂𝗿𝗲-𝗯𝗮𝘀𝗲𝗱 𝗦𝗼𝗹𝘂𝘁𝗶𝗼𝗻𝘀 in Southeast Asia

[There’s a lot here, we know… Feel free to download the slides to keep as your personal cheat sheet]

This is a general overview of the 𝘀𝘂𝗶𝘁𝗮𝗯𝗶𝗹𝗶𝘁𝘆 𝗹𝗮𝗻𝗱𝘀𝗰𝗮𝗽𝗲 and 𝗼𝘂𝗿 𝗿𝗲𝗰𝗼𝗺𝗺𝗲𝗻𝗱𝗮𝘁𝗶𝗼𝗻𝘀 for which standards to use in Indonesia, Thailand, The Philippines, Malaysia, and Cambodia based on specific insight from their national priorities, precedents, and systems in place

As you can see, Verra’s Verified Carbon Standard and the Gold Standard dominate the current project landscape…

That being said, new standards are quickly arriving on the scene, appealing to different niches and types of project. We’ll keep you updated as the space grows and more projects are registered with these different standards.

➡️ Swipe for a detailed overview and our recommendations for the most applicable standards to use in each country (and for each kind of NbS project). [Link to the Linkedin post here]


CONCLUSION  

Through this analysis, we aim to shed some light on the complex world of carbon certification standards at a time where financial sponsors and buyers of carbon credits are looking for clarity and visibility over the quality of their investments and purchases.  

HAMERKOP’s experts have more than a decade of experience working with the carbon market ecosystem, including reviewing and supporting the creation of new certification standards and methodologies and supporting project developers in selecting the right standard for them and designing their climate change mitigation intervention accordingly. If you are looking for support in this space, we can help, reach out to us

This is a highly dynamic space and if you know of a scheme that would fit on these maps, do let us know as we will update this map regularly! 

 
Hamerkop team
Six Ways to Strengthen Your Carbon Project and Unlock Better Credit Prices
 

At COP29, one message rang loud and clear: the money isn’t flowing fast enough. After intense negotiations, developed countries agreed to mobilise $300 billion per year through 2035 to help developing nations tackle climate change. But that’s far below the estimated $1.3 trillion per year that low- and middle-income countries say they need to stay on track. 

This growing finance gap raises an urgent question: how can we unlock new sources of funding to meet the scale of the challenge? One powerful answer is carbon pricing, a mechanism that turns emissions into a cost, and climate action into a market opportunity. By placing a price on carbon emissions, it creates the incentive and financial logic for companies and governments to reduce their footprint and invest in climate solutions. 

At the centre of this mechanism is the carbon credit, a unit representing the reduction or removal of one tonne of CO₂ or its equivalent. These credits are traded in compliance and voluntary carbon markets. And while the carbon market has faced its share of challenges, it is rapidly evolving and increasingly recognised as a tool that can move money where it’s needed most. 

But success isn’t guaranteed. Issues like over-crediting, unclear baselines, weak co-benefit integration, and upfront cost barriers have all slowed progress. If we want to harness the full potential of the carbon market, we need to get serious about quality, credibility, and strategy. 

At HAMERKOP, we’ve worked on over 150 climate finance assignments across more than 50 countries. From this experience, we’ve distilled six principles that can help project developers design and deliver carbon projects that not only reduce emissions, but also command higher prices, attract the right buyers, and deliver lasting impact. 


1. Understand the demand for your type of carbon credit 

Just like in any market, the price of carbon credits is influenced by supply and demand. In the voluntary carbon market, demand is largely driven by the growing number of global companies making net-zero commitments and seeking to offset their residual emissions. These pledges are translating into real purchases, particularly during companies’ annual carbon credit retirement cycles, when they retire credits to meet their public climate goals. 

A strong example of this trend is Google’s US$200 million pledge to Frontier. Frontier is an initiative that secures long-term demand for carbon removal technologies by supporting project developers with early financial certainty. Through this commitment, Google and other backers are helping ensure that the market continues to move toward high-quality, permanent carbon removal solutions. 

However, demand is not uniform or guaranteed. It fluctuates based on broader economic conditions, regulatory changes, internal decarbonisation progress within companies, and the shifting relationship between voluntary and compliance carbon markets. For project developers, understanding these dynamics is essential in order to align their efforts with where the market is heading. 

Before investing in a project, developers should assess where demand is strongest and what buyers are actually looking for. This includes identifying whether current interest leans more toward removals or reductions, which social and environmental co-benefits are valued most, and which geographies are emerging as high-potential regions. Market platforms such as Climate Impact X offer real-time insight into buyer preferences, while reviewing requests for proposals and engaging with buyers or intermediaries early on can provide strategic direction. 

Selecting the right carbon standard and methodology is equally important. As the Integrity Council for the Voluntary Carbon Market continues its work to define “high-integrity” through its Core Carbon Principles, buyers are increasingly favouring credits aligned with these criteria. Projects that meet these emerging expectations from the outset are more likely to attract serious interest and secure better prices as the market shifts toward greater transparency and accountability. 


2. Design for co-benefits, not just carbon

The carbon market is evolving quickly, and so are buyer expectations. It is no longer just about how many tonnes of CO₂ a project can reduce or remove. Increasingly, buyers are asking what else the project delivers. Projects that provide environmental and social co-benefits such as improved local livelihoods, restored biodiversity, or progress on gender equality are viewed as higher quality and are more likely to receive a premium price. 

These “beyond carbon” contributions are increasingly seen as indicators of both quality and ambition. Buyers and investors are actively seeking projects that align with broader sustainable development goals. In response, many developers are adopting more holistic approaches that place greater emphasis on social, biodiversity, and wider environmental outcomes. This is reflected in the use of methodologies with more rigorous baselines, monitoring systems, and safeguards to ensure these co-benefits are credible and lasting. Some are also leveraging emerging technologies to enhance transparency and traceability. 

These co-benefits can also be formally recognised through co-certification schemes. Climate, Community, and Biodiversity Standard (CCB) Sustainable Development Verified Impact Standard (SD VISta) allow projects to demonstrate their wider impact. These labels help build trust with buyers and can justify premium pricing. 

Designing for co-benefits is no longer just a nice-to-have. Particularly for nature-based projects, it is a smart strategy in a market increasingly values credibility, inclusiveness, and long-term impact. Projects that can show clear, measurable benefits beyond carbon will have a stronger position and greater appeal as expectations continue to rise. 


3. Think strategically about offtake agreements vs. spot transactions 

The way you sell your carbon credits can have a major impact on your project's financial sustainability and long-term success. Developers typically choose between two main options: spot transactions or offtake agreements. Each approach has its own benefits and challenges. 

Spot transactions involve selling credits at the current market price, providing immediate income and greater flexibility. This can be useful for projects seeking short-term cash flow. However, spot sales expose projects to market fluctuations, making it harder to predict revenue and plan for future operations or reinvestments. 

In contrast, forward purchase agreements and long-term offtake deals offer more financial stability. These agreements secure a buyer or group of buyers at a fixed price for credits delivered over several years. The predictable income helps cover early-stage costs, ongoing expenses, and can even support pre-financing strategies, such as loans or grants backed by future revenue. This model is especially beneficial for projects that are capital intensive or in their early stages of development. 

It is also important to consider the type of buyer. Aggregators, brokers, and large corporate purchasers can streamline transactions, reduce negotiation burdens, and broaden market access. However, selling directly to an end buyer can increase margins and foster stronger partnerships, particularly when the buyer’s values align closely with the project’s goals. 

No matter the sales strategy, transparency is essential. Clear delivery schedules, contractual terms, and alignment with the buyer’s sustainability objectives help build trust and credibility. This not only supports the immediate sale but also enhances the project’s reputation and resilience in the evolving carbon market.  


4. Stay ahead of compliance trends

The line between voluntary carbon markets and compliance markets is becoming increasingly blurred. This convergence is opening up new opportunities for project developers while also raising the bar for quality and credibility. 

As the global carbon landscape evolves, new frameworks are reshaping how credits are issued, certified, and valued. Key initiatives include Article 6 of the Paris Agreement, Carbon Offsetting and Reduction Scheme for International Aviation (CORSIA), and integrity-focused platforms such as the Integrity Council for the Voluntary Carbon Market (ICVCM) and the Voluntary Carbon Markets Integrity initiative (VCMI). Buyers are now looking for credits that come with additional certifications or labels, which indicate that the credits meet emerging standards for environmental integrity, transparency, and compatibility with future compliance use. 

Although many host countries are still setting up systems to implement Article 6, demand for high-integrity credits is already growing. Governments, airlines, and institutional investors are preparing to source credits that meet international compliance requirements. These credits are expected to trade at higher prices because of their added credibility and potential regulatory value. 

Some countries have already built formal links between voluntary and compliance markets. Singapore allows companies to offset up to five percent of their carbon tax obligations using approved international voluntary credits. Other jurisdictions such as Colombia, Chile, South Africa, and California have created compliance programs that accept certain emission reduction credits. These hybrid systems are strengthening market confidence and encouraging the development of compliance-aligned VCM projects. 

Meanwhile, integrity initiatives such as ICVCM and VCMI are playing an increasingly influential role in the carbon market. By setting clear criteria for what defines a high-quality carbon credit and how such credits should be used, these organisations are shaping market expectations and buyer behaviour. As a result, credits aligned with frameworks like ICVCM are seen as more credible and are better positioned to attract premium prices. 

For project developers, this convergence represents both a challenge and an opportunity. Looking ahead, aligning with compliance-grade methodologies and securing recognised third-party certifications may significantly increase a project's value and future-proof it in a rapidly changing market. 


5. Promote your project with purpose and precision

In the carbon market, how you communicate your project is just as important as how you design it. Clear, credible communication shapes how buyers perceive your project and can significantly influence how much they are willing to pay for your carbon credits. 

Buyers are not only purchasing emissions reductions; they are investing in a story. Projects that effectively highlight their co-benefits and broader environmental or social impact tend to stand out. Whether your project restores degraded landscapes, empowers communities, or protects biodiversity, presenting these elements through a compelling narrative attracts buyers who value integrity and are often willing to pay a premium for it. 

However, storytelling alone is not enough. Credibility matters. The voluntary carbon market has faced growing scrutiny, with several high-profile controversies casting doubt on certain project types. Even high-quality projects can be overlooked if they are not understood or trusted. In this environment, buyers are exercising greater caution and placing more emphasis on transparency, independent verification, and solid governance structures. 

This shift in buyer behaviour presents an opportunity. Projects that prioritise strong communication, pursue recognised certifications, and actively engage stakeholders can build trust and stand apart in a crowded market. By clearly demonstrating impact and positioning your project as part of the solution, you enhance its credibility and increase the likelihood of securing premium pricing for your credits. 


6. Demonstrate low risk and build market confidence

As the voluntary carbon market becomes more mature, transparent, and focused on quality, the role of risk perception in pricing is growing rapidly. Buyers are becoming more selective, and they are rewarding projects that can clearly demonstrate credibility, integrity, and low exposure to risk. 

One of the clearest indicators of this shift is the rise of carbon credit ratings. These ratings directly influence how credits are priced. Projects that receive high ratings based on factors such as quality, permanence, and additionality are more likely to attract premium pricing. In contrast, projects with lower ratings may struggle to find serious buyers. For developers, earning a strong rating can improve market visibility and send a powerful signal to prospective partners. 

At the same time, price transparency in the market is improving. More platforms are making credit benchmarks publicly available, allowing developers to better assess the market value of their credits. This shift supports fairness and reduces the influence of speculation or misinformed pricing, especially for high-integrity projects. 

Reputation has also become a key differentiator. Corporate buyers, in particular, are under increasing pressure to avoid the reputational risks associated with greenwashing. As a result, they are gravitating toward projects that can demonstrate clear additionality, measurable co-benefits, and robust third-party monitoring and verification. These qualities help position a project as trustworthy and align with what buyers now expect from responsible investments. 

The conclusion is clear. In a market where quality and credibility drive demand, demonstrating your project’s low-risk profile is no longer a nice-to-have. It is a strategic advantage that can improve market access, build buyer trust, and support stronger credit pricing. 


Final Thoughts

The voluntary carbon market is evolving quickly. While challenges remain, there are growing opportunities for project developers who are strategic, transparent, and focused on delivering meaningful impact. 

By understanding buyer demand, designing projects with co-benefits, adopting strong financial strategies, aligning with compliance frameworks, communicating with credibility, and managing risk effectively, developers can unlock real value and stand out in the market. 

At HAMERKOP, we help developers and investors build high-quality, investable carbon projects across all major standards and sectors. Our work spans REDD+, blue carbon, energy access, biochar, agriculture, agroforestry and reforestation. We are committed to helping you translate ambition into action and deliver measurable, lasting results. Get in touch to learn how we can support your next climate initiative. 

 
Hamerkop team
The HAMERKOP Internship Experience: Three Perspectives

In 2024, HAMERKOP had 3 interns join us and go on to become full time members of the team. We asked them each to write about their experience.


Maëna Raoux

Arriving at HAMERKOP: a search for integrity in carbon markets

When I joined HAMERKOP Climate Impacts as an intern, I had just completed the final modules for my master's program in Climate Change Management and Finance at Imperial College London. I had moved to London for this program, and it required a work placement to complete the degree.  

Prior to my master’s, I had spent over a year and a half analysing corporate sustainability strategies and commitments as a sustainability analyst at EcoVadis in Paris. That role had given me a front-row seat to the good, the bad, and the greenwashed in corporate climate efforts and when it came to carbon markets, I wasn’t really sold. The market’s mechanisms, the permanence of nature-based solutions (NbS), and the motivations of corporate players investing in these markets all raised questions for me. Were carbon markets genuinely effective in mitigating climate change? Were they a necessary pathway to achieving global net-zero ambitions, or merely a tool for corporates to improve their reputations with minimal substantive change? My scepticism stemmed from some of the challenges I had observed and learnt about the fragility of permanence in NbS projects and the risk of greenwashing and over crediting that has loomed over the market. While not new, these critiques are particularly relevant and made me want to experience the industry and market firsthand. I soon realised I wanted to work in an environment where I could engage critically with carbon markets.  

As an organization that does not tie its payment structure to carbon credit generation and can therefore provide advice based on a project’s quality and the market’s direction, HAMERKOP stood out to me. I considered their independence as essential to ensuring that my work would not only be meaningful but also allow for the kind of nuanced, critical engagement I was seeking. I also recognised that in an environment where carbon markets are being scrutinized, the availability of technical and science-based advice on what constitutes high-quality and high-integrity credits, is more important than ever. This is exactly why I was eager to join HAMERKOP. 

Working at HAMERKOP: gaining insights and developing new skills  

My first day at HAMERKOP was very welcoming and the days that followed provided me with the time to learn and ask questions as I met with each member of the team individually, getting to know them as well as the work they were involved with. During this period, I was encouraged to ask questions, dive into the work at my own pace, and contribute to a variety of tasks. Some assignments were operational, while others involved direct client deliverables. Among the various tasks I was involved in, my favourite assignment was conducting due diligence for corporates interested in investing in carbon projects. This sometimes almost felt akin to detective work – uncovering potential risks and red flags while meticulously assessing projects’ carbon potential and socioeconomic impacts. I was particularly drawn to projects that went beyond carbon to deliver broader development benefits and incorporate local stakeholder consultation and benefit-sharing mechanisms into their design. 

Parallel to my internship, I worked on my master’s final report, which examined the issue of permanence NbS carbon projects. Specifically, I analysed how existing buffer pools in the Voluntary Carbon Market (VCM) are inadequate in guaranteeing permanence and making the case for in-kind insurance as a potential solution. This research also developed my interest for robust monitoring, reporting, and verification (MRV) systems, particularly those that include non-carbon metrics to ensure long-term project integrity. 

HAMERKOP also helped me develop my understanding of geospatial analysis – an area I had always appreciated but never had the chance to explore practically. In fact, various projects that I have been working on directly demonstrate the relevance of remote sensing techniques in understanding the land use and land cover change (LULC), monitoring deforestation and degradation rates, but also as a tool to estimate biomass and carbon stocks by analysing parameters such as vegetation cover, tree height and tree density. I have particularly enjoyed being immersed in an environment where I am constantly learning and being exposed to new challenges that are key to resolve to ensure the development of high impact and high-quality carbon projects. 

As my internship has come to an end, I am now excited to join HAMERKOP’s full-time team. The past months have not only deepened my technical expertise, especially in NbS projects and carbon metrics, but have also given me a much more nuanced perspective on carbon markets. While my initial scepticism hasn’t yet fully disappeared, it has evolved into a more balanced outlook, informed by hands-on experience and a deep appreciation of carbon markets’ complexities. I now look forward to further developing my understanding of NbS projects by learning alongside my colleagues who are experts in this field. 


Solène Kechavarzi

My Internship Experience at HAMERKOP  

When I first joined HAMERKOP as an intern, I knew I was stepping into a world that was both exciting and unfamiliar. Coming from a background in Biological Sciences, with a specialization in Biodiversity and Conservation, I had always been passionate about environmental sustainability. However, my experience had primarily been rooted in academic research, and the practical application of climate impact mitigation through carbon projects was entirely new territory for me. Over the course of my internship, I gained invaluable insights into the intersection of environmental science and business, and I am deeply thankful for the opportunity to learn and grow within such a dynamic organization. Working within this framework, I was able to see firsthand how environmental and climate goals can be translated into measurable outcomes that benefit both communities and ecosystems. 

One of the most memorable aspects of my internship was the opportunity to travel to Douala, Cameroon, to participate in a mangrove restoration project. This experience proved to be both challenging and rewarding, as it combined fieldwork, data collection, and environmental analysis. Alongside a dedicated local team, we conducted a carbon forest inventory the mangrove ecosystem of the Wouri estuary. This process involved measuring tree parameters (diameters at breast height and height), assessing species composition, and estimating biomass to establish baseline data for future carbon credit calculations. Being immersed in the mangrove environment not only deepened my understanding of carbon accounting methodologies but also reinforced the importance of preserving these vital ecosystems. 

The field experience in Cameroon was particularly impactful because it illustrated the practical steps involved in translating science into scalable projects. I was able to witness how local stakeholders and conservation professionals collaborate to restore degraded landscapes while simultaneously creating economic opportunities through carbon credit markets. It was inspiring to see how science-based solutions can drive meaningful environmental change. 

Throughout my time at HAMERKOP, I was continually impressed by the dedication and expertise of the team. The level of commitment to sustainability and technical rigor is evident in every project. The mentorship I received was instrumental in helping me navigate the complexities of carbon certification processes, field methodologies, and data analysis. I am especially grateful for the patience and encouragement that my colleagues provided as I transitioned from a more academic background to working in such a results-oriented setting. 

This internship has been an incredible learning experience. It has showed me that protecting biodiversity can go hand in hand with addressing climate change and fostering sustainable development. It has also given me a newfound appreciation for the role of carbon markets in promoting environmental stewardship. 

I leave this experience with a deep sense of gratitude and excitement for the future. To anyone considering an opportunity with HAMERKOP or in the field of carbon projects more broadly, I can confidently say that it is a path worth exploring. The work is not only impactful but also deeply fulfilling. I am excited to continue working with HAMERKOP in the future, where I have started a full-time role as an Associate Consultant. 


Mikael Minten

My Internship Experience at HAMERKOP  

Starting my internship with HAMERKOP was both exciting and daunting. Having studied Environmental Science and Ecology in Edinburgh, I had a solid grounding in environmental issues but little knowledge of carbon markets. The role at Hamerkop seemed like the perfect opportunity to bridge that gap and learn about an industry that was both complex and hugely important. 

I arrived at the HAMERKOP during a particularly hectic period. The team had just taken on several large contracts, and everyone was deep in work. It was a bit overwhelming at first, but at the same time it was also great—I was immediately thrown into real projects where I could apply what I had learned in my studies.  

In my first few days, I had one-on-one meetings with everyone in the office, learning about their backgrounds and roles. These chats, along with lunchtime conversations (often outside, thanks to the summer weather), helped me settle in quickly. The team was incredibly welcoming, and within a couple of weeks, they officially welcomed me with a trip to the pub—always a good sign! 

As things calmed down slightly, I was able to branch out into different aspects of the business and get a broader understanding of carbon markets. There was a running list of activities I could take on, which gave me a great starting point. Three of my key tasks were: 

  • Updating the Carbon Handbook: With guidance from the team, I worked on updating our Carbon Projects handbook, the last version of which came out in 2021. This included revamping some of the outdated material and enhancing clarity to make it more accessible and easier to navigate. The handbook is used as a broad introduction to carbon projects, so diving into it really helped me understand carbon market fundamentals. 

  • Updating Carbon Standards for Blog and LinkedIn Posts: This was also a follow-up on a series of blog and LinkedIn post we had released in 2023 where we shared insights from data collected on over 65 carbon standards. I was amazed at the amount of standards that existed—each with its own unique approach to the carbon markets. The update required extensive outreach—following up with various organisations via LinkedIn and email to ensure we had the most up-to-date information. 

  • Working on Geospatial Analysis: Another key role I took on was contributing to the organization’s geospatial analysis for many of our nature-based project. This gave me valuable insight into how remote sensing is integrated into project design and planning. Along the way, I became more proficient with tools like QGIS, EarthBlox, and R while exploring the wide range of available datasets. One of the biggest learning experiences was using remote sensing to conduct a stratification analysis—dividing a mangrove forest in Cameroon into high and low biomass areas based on remotely sensed data. 

Beyond these main projects, I dipped in and out of various other workstreams, including emission reduction modelling, drafting and designing projects, and project due diligence.  

The internship was a steep learning curve, but it was exactly what I had hoped for—real, applicable experience in an area that is rapidly growing in importance. Looking back, I feel incredibly grateful for the opportunity to work with such a knowledgeable and supportive team. It was a brilliant introduction to the world of carbon markets, and I’m excited to see where this experience takes me next! 

Hamerkop team
Launch of the Biochar Manual for Carbon Removal

The world needs carbon removal and biochar is leading the way for the carbon removal market. Read the IBI-HAMERKOP Biochar Manual for Carbon Removal for a comprehensive introduction to biochar, carbon removal programs and how to create your own biochar carbon reduction project.  

Most climate change mitigation measures consist of avoiding the emission of GHGs into the atmosphere. However, with concentrations of carbon dioxide in 2022 reaching an all-time high of 421 parts per million (PPM), it is clear that we must embrace carbon removal in addition to avoidance strategies. With 94% of 2023 carbon removal deliveries coming from the production of biochar [1], continuing to scale this growing industry is essential to removing carbon from our atmosphere.  

Biochar is a black, carbon-rich solid obtained from the high temperature carbonisation of biomass in an oxygen free environment. Its high carbon content and resistance to abiotic and biotic degradation makes it a powerful carbon sequestration tool, and its other properties like high porosity and water holding capacity make it useful in numerous applications like in soil as an additive, in purification systems and even in animal feed.  

Producers of biochar can get financial support for their projects by registering and certifying their projects with one of many carbon removal standards. Certification is an important step all biochar carbon removal projects go through, as it ensures quality and integrity of the carbon sequestration credits produced which is essential for buyers. 

Biochar mixture ready to be applied to soil via GIZ Bush Control and Biomass Utilisation Project

Choosing the right standard and completing registration of biochar carbon removal projects can be a complex task, and the amount of technical details involved can be overwhelming. The IBI-HAMERKOP Biochar Manual for Carbon Removal provides a unified source of information and is essential reading for those interested in biochar as a carbon removal tool, with insights on: 

  • Biochar characteristics  

  • Guidance for the design and certification of biochar projects (technology and feedstock considerations, biochar end use, eligibility, etc.)  

  • Differences and characteristics of methodologies and carbon certification standards (i.e. registries)   

  • Guidance on the steps required to build your own biochar project (e.g. emission calculations, monitoring procedures and carbon project registration requirements) 

The Biochar Manual for Carbon Removal was created to remove barriers to the biochar market by bringing together all the information required for project developers to set-up a carbon-financed biochar project, and for financial sponsors to understand the underlying assumptions behind carbon credits from biochar, into one easy-to-access manual. 

The Biochar Explosion

Biochar has been utilised as a soil amendment for thousands of years, but recently has garnered further interest for its carbon storage capabilities. Biochar producers have received funding from multinational companies such as: Microsoft, JP Morgan Chase, Swiss Re and Nasdaq, among many others looking to invest in carbon removal projects. These organisations have been a driving force behind the acceleration of new biochar projects development around the world.  

Figure 1 – Total tonnes of carbon removal delivered [2]

First-of-its-kind research recently highlighted that biochar’s potential to scale carbon removals as a win-win solution for people and the planet could potentially remove up to 6% of global annual GHG emissions [3]. 

While there were less than 1,000 tonnes of biochar-linked CO2e removal units (tCO2e) in 2020, this grew to 34,000 tCO2e in 2022, and to 65,000 tCO2e in 2023. This rapid growth in production is set to continue through the 2020s.  

Biochar production and application is one of the most cost-effective long-term carbon storage solutions. It can be set up at different scales, take place anywhere in the world and production can be up and running within weeks or months, rather than years. Despite this sustained increase in production, increase in demand for carbon removal is growing at an even quicker pace, making biochar projects an attractive value proposition for developers looking to join the carbon market. 

How to use the Biochar Manual for Carbon Removal  

Biochar’s multi-faceted nature can be a blessing and a curse – information on biochar’s characteristics, its use and how to enter the carbon removal market using biochar can all be difficult to find and technically complex. The Biochar Manual removes this information barrier and provides details on standards, methodologies and production technologies.  

Potential project developers and financial sponsors can learn more about biochar, how the various carbon certification standards compare in their requirements to issue carbon removal units, and the processes of each certification standards to issue credits for biochar. The guide should be used as a stepping stone into the world of carbon finance for biochar developers and sponsors to make fully informed decisions about the future of their activities. 

Once a biochar production activity has been designed (e.g., technology, quantity and type of feedstock, location, application, etc.), the Biochar Manual for Carbon Removal can be used to pre-select the most adapted carbon certification standard by using the comparison matrix. Once a few potential standards and methodologies have been selected, it is necessary to meticulously assess their rules and requirements, together with potential changes since the release of the manual. It can also be valuable to engage with a technical consultant such as HAMERKOP, or with the standards themselves to obtain answers to project-specific questions.  

What Does a Successful Biochar Project Look Like? 

The success of biochar projects come from their versatility. By using a feedstock that would otherwise go to waste, and utilising the biochar on soil, biochar projects act as waste management, fertiliser reduction, and energy generation projects at the same time.  

Successful biochar projects tailor their activities and features to the individual and local circumstances. For example, using a high-calorie feedstock that produces lots of thermal energy is great for projects that can utilise that energy, e.g. for drying coffee beans or for heating water, but is a wasted opportunity for projects who will not utilise the heat produced.  

Equally, biochar projects are a valuable carbon removal tool when the biochar can be used locally, but if the biochar or feedstock must be transported long distances then project’s positive environmental impact is reduced.  

The Biochar Manual for Carbon Removal helps developers, sponsors and interested stakeholders understand the main features of best-in-class projects, by providing answers to questions such as: 

  • What feedstock is eligible for each carbon certification standard or registry?  

  • Do I need certification for my biochar?  

  • What technologies can I use to produce biochar?  

  • What standards does the biochar I produce need to reach?  

To answer these questions and many more, download the Biochar Manual for Carbon Removal by clicking the button below, and begin growing your biochar project today!

The Manual
 
Hamerkop team
HAMERKOP’s Test Flight With AI

Saying Hello to Artificial Intelligence at HAMERKOP and in the Climate Finance Industry 

Author: Jit Ping, Spring 2024


The AI (Artificial Intelligence) wave has taken the world by storm and no person or industry is spared from its effects. The climate finance industry is well-positioned to leverage the powers of AI to deliver greater value for all stakeholders involved. Indeed, we are not too far away from a world where AI can evaluate the feasibility of various carbon projects and recommend new projects in locations we have not previously thought of.  

By way of introduction, I am Jit Ping and I embarked on a two-month internship earlier this year as an AI research intern to find out how HAMERKOP and the broader industry can utilise AI today and in the future. I am happy to share in this blog post a few insights from my time with HAMERKOP. (click here to learn more about my internship experience!) 


What is AI?

AI broadly seeks to perform tasks that require human intelligence [1]. Satya Nadella, Microsoft CEO, summarises AI succinctly when he notes that AI is not just about delivering information to users but “about intelligence at your fingertips or expertise at your fingertips” [2].  Indeed, AI has been proven to have strong potential in detecting various cancers earlier and more accurately [3]. AI’s life-altering capabilities extend beyond the individual to the entire world. AI is being used to determine the pace of iceberg melting and where to focus ocean cleanup efforts [4].

LLMs (Large Language Models) such as ChatGPT, Gemini and Claude marked the introduction of AI into the public consciousness and generated strong public interest due to their ease of use and their potential to replace many white-collar office jobs we previously thought irreplaceable. The ability of LLMs to read and write is exemplified by the strong performance of GPT-4 on the bar exam typically taken by lawyers [5]. Crucially, LLMs can analyse and generate texts on a much larger scale than humans. For example, Anthropic's Claude AI can process lengthy novels like The Great Gatsby in a single query [6].

LLMs represent only a small sliver of what AI can do. AI’s greatest promise lies in the realm of machine learning [7]. Machine learning relies on computer systems interpreting data to find relationships and make future predictions [8]. The hype around machine learning stems from their ability to unearth patterns humans could never discover and their ability to train using a massive corpus of data. For example, machine learning algorithms can use software attached to wind turbines to help schedule preventive maintenance works before a breakdown occurs [9].


AI Use Case 1 – Reading & Writing Reports  

The ability for LLMs to write is unparalleled and unquestionable. In fact, Japanese author Rie Kudan won her country's prestigious Akutagawa Prize for her book while revealing that “probably about 5% of the whole text is written directly from the generative A.I.” [10].  Experts believe that generative AI (which includes LLMs) has significantly improved technology’s ability to achieve human-like abilities in creativity and social-emotional behaviours [11]. 

While LLMs might be good in the realm of writing and generating ideas, are they as good in the business world? After all, HAMERKOP and most other firms are interested in precision and factual accuracy. HAMERKOP’s trial with LLMs suggests that while it is right most of the time, AI frequently produces undoubtedly wrong output. AI has made up numbers that do not exist in reports and has struggled to understand the full context of lengthy documents.  

Indeed, the failures of LLMs to get basic facts right or understand basic instructions are well documented. LLMs are designed to be “probabilistic and sometimes unpredictable” [12] and are in reality just very good sentence generators. This means that their ability to solve 2+2=4 is not based on a fundamental understanding of mathematics and is not guaranteed. AI researchers term some of AI’s failures as “hallucinations”, such as when they contradict themselves in answers or make up facts that do not exist [13]. 

It is clear that LLMs cannot be autonomously given work to perform without any human intervention and guidance. However, there is still a role for LLMs in HAMERKOP and other companies. LLMs can be used to comb through lengthy documents to find a specific data point (or to refer to the relevant page where the information resides) and to synthesise chunks of texts into a neat table.  

Even if LLMs can extract information well, their true promise comes if it can do it at scale. At present, most information on carbon projects resides in various monitoring and verification reports. However, the reporting of such information is not in a standardised format – sometimes the information is found as a mathematical symbol or is simply not present at all. Additionally, LLMs struggle with mathematical tabulation of values when verification reports overwrite or add-on to past information [14].  The goal of creating a system which can process documents en-masse while ensuring “cost, quality, and generality” is still an active discussion amongst academics [15]. Hopefully such technology will enter the mainstream in the not-too-distant future.  


AI Use Case 2 – Making Quality Predictions   

AI can overcome the two biggest stumbling blocks to the successful implementation of a climate project – labour cost and uncertainty. The most labour-intensive work in a climate project is often fieldwork. Reforestation projects require lengthy land analysis to determine the potential emission reductions and to monitor projects after their implementation. AI is used to analyse satellite imagery and can annotate the characteristics of an ecosystem and track any changes that occur in its make-up [16].    

Projects require investments to operate, and investors require a good idea of the returns they can expect before they commit to any funding. AI can analyse vast swaths of past data to make predictions about the future. For instance, they can analyse the expected amount of credits generated from a project and the potential price each credit can sell for [17].

Indeed, a plethora of companies are entering the industry aiming to use AI to help companies implement their project from start to finish. For instance, some use a LLM to answer pertinent questions about the carbon market and about getting a project started. They attempt to provide softwares that allows project owners to receive funding, document project details and connect with other stakeholders [18].  Similarly, some others are working on a suite of AI software that would help with geospatial analysis, choosing the right methodology and writing project description documents [19].

The performance of AI models in tasks like land surveys and predictions ultimately depends on the quality and quantity of data used for training, as well as the training methodologies employed. However, developers are loath to disclose detailed information about their datasets or training approaches. As a result, AI models, particularly neural networks, often remain opaque "black boxes" because their internal reasoning and the process by which they arrive at specific outputs are not fully transparent or understood [20]. To enhance trust in AI model outputs, researchers would benefit from having access to detailed explanations of the models' decision-making processes and the ability to independently reproduce and validate the results.  


Conclusion - Using AI vs Being Used By AI  

The “Jagged Technological Frontier” of AI

It is clear that the central question for HAMERKOP and other businesses is not whether to use AI but rather how to use it well.  

Training employees to be AI-ready is certainly the most important factor. Firstly, it is important for one to be aware of the limitations of AI. Reading this article alone would have made you aware that AI can invent facts and shouldn’t be blindly relied upon. Additionally, researchers at the Harvard Business School believe that there is a “jagged technological frontier” whereby tasks of similar difficulty are either achievable by AI or incapable of being completed [21]. Knowing whether a task is inside or beyond the frontier will ensure time is saved and not wasted when using AI.  

Secondly, simple prompt engineering techniques can greatly improve the results that LLMs produce. For instance, Anthropic’s Claude LLM models perform over 30% better in multiple choice tests when the reference text is placed at the beginning of the prompt and not the end [22]. Training users in prompt engineering can ensure AI delivers more accurate information and in the format users expect.  

The climate finance industry has only just embarked on its AI journey. To benefit from the vast potential of AI, firms need to embrace AI in its entirety – by empowering all employees with the skills to use the latest AI tools effectively.   

[Disclaimer: Claude 3 helped with the proofreading of this article.]

References:

  1. https://www.britannica.com/technology/artificial-intelligence 

  2. https://www.weforum.org/podcasts/meet-the-leader/episodes/davos-2024-conversation-microsoft-satya-nadella/ 

  3. https://health.google/intl/ALL_uk/health-research/imaging-and-diagnostics/ 

  4. https://www.weforum.org/agenda/2024/02/ai-combat-climate-change/ 

  5. https://www.reuters.com/technology/bar-exam-score-shows-ai-can-keep-up-with-human-lawyers-researchers-say-2023-03-15/ 

  6. https://twitter.com/AnthropicAI/status/1656700156518060033?lang=en 

  7. https://hammerspace.com/is-2024-the-year-of-the-enterprise-llm/ 

  8. https://britannicaeducation.com/blog/ai-in-education/ 

  9. https://plat.ai/blog/predictive-maintenance-machine-learning/ 

  10. https://www.smithsonianmag.com/smart-news/this-award-winning-japanese-novel-was-written-partly-by-chatgpt-180983641/ 

  11. https://www.mckinsey.com/capabilities/mckinsey-digital/our-insights/the-economic-potential-of-generative-ai-the-next-productivity-frontier#work-and-productivity 

  12. https://medium.com/@glovguy/large-language-models-reasoning-capabilities-and-limitations-951cee0ac642 

  13. https://www.vellum.ai/blog/llm-hallucination-types-with-examples 

  14. https://bezerocarbon.com/insights/generative-ai-techniques-can-drive-standardisation-and-increased-transparency-to-the-vcm 

  15. https://arxiv.org/pdf/2304.09433.pdf 

  16. https://medium.com/@Gaurav_writes/machine-learning-for-forest-monitoring-algorithms-use-cases-challenges-4b9f3fb2e766 

  17. https://drive.google.com/file/d/1wq5612Ag1FlMwiFsYnAjEXOcN0HZXZVG/view 

  18. https://www.ivyprotocol.com/ 

  19. https://www.nika.eco/carbongpt 

  20. https://towardsdatascience.com/why-we-will-never-open-deep-learnings-black-box-4c27cd335118 

  21. https://www.hbs.edu/ris/Publication%20Files/24-013_d9b45b68-9e74-42d6-a1c6-c72fb70c7282.pdf

  22. https://www.youtube.com/watch?v=6d60zVdcCV4&t=1741s

Guest User