
NbS Carbon Credit Supply in Southeast Asia: Market Structure and Trends in 5 Key Countries
Summary
This article presents a landscape market analysis of nature-based solution (NbS) carbon credit supply across 5 Southeast Asian (SEA) countries: Indonesia, Malaysia, Cambodia, Thailand, and The Philippines (as of April 2025) [Footnote 1].
The focus is primarily on carbon credits issued under international standards including the Verified Carbon Standard (VCS) and the Gold Standard (GS), as well as domestic standards such as Thailand Voluntary Emission Reduction Program (T-VER). Altogether, they represent the dominant certification systems in the regional voluntary carbon market (VCM):
5 SEA countries have contributed a total of 129 million Verified Emission Reduction (VER), with 33.72% (43 million credits) remaining unretired. The main contributors are Indonesia (59.3%) and Cambodia (37.0%), both primarily focused on REDD+ projects.
Indonesian projects have not issued credits since 2022 amid regulatory changes, though recent progress with major standards signal towards the reopening of international issuance.
Unretired older vintages in Cambodia and Indonesia may face declining market value, while Cambodian projects demonstrate an active supply with more recent vintages.
Indonesia exhibits stronger market uptake than Cambodia, with a retirement rate of 82.3% and larger issuance volumes of 76 million credits.
Across all 5 countries analysed, removals show 12% higher retirement rates than avoidance-only credits.
28 projects are currently under development, in addition to 13 already registered, suggesting a promising pipeline for future issuance.
T-VER projects represent a strong future supply source, with 1.2 million VERs expected annually from forestry and agriculture projects, despite currently limited issuance under the GS or the VCS.
Section 1: Supply Overview
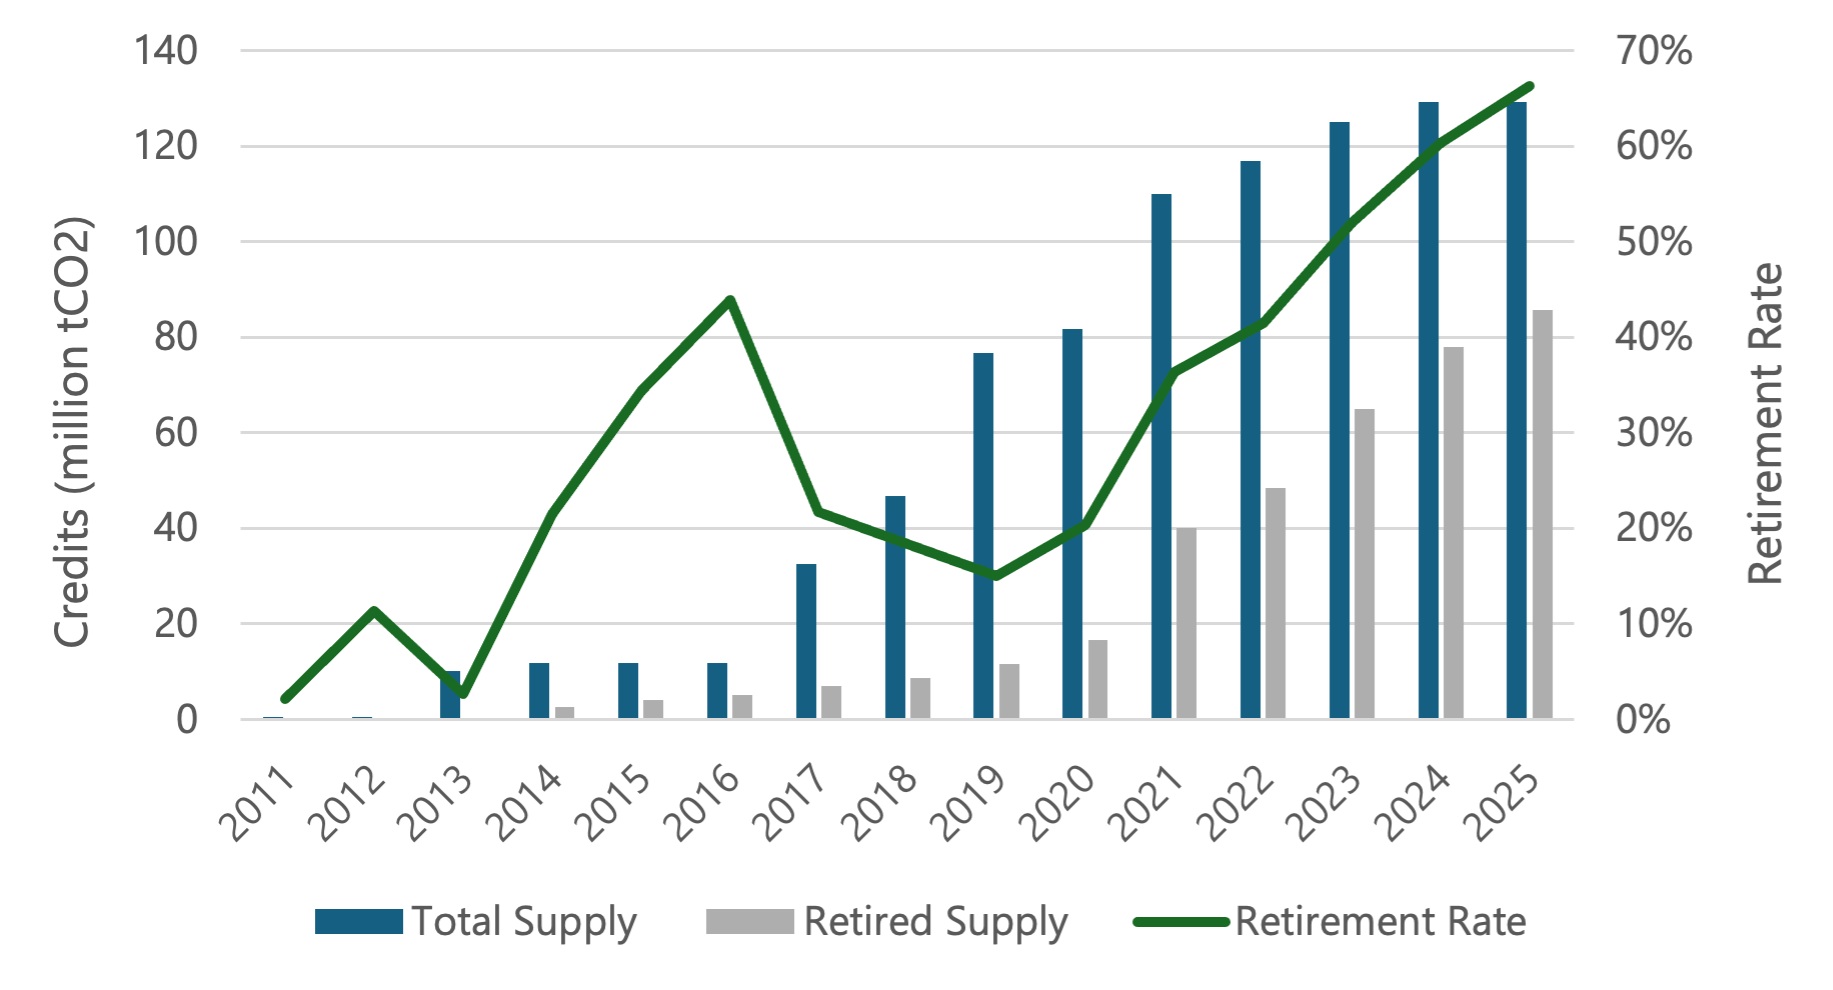
Figure 1 - Trends in cumulative carbon credit supply, retirement, and retirement rate on the VCM (2011–2025) across 5 SEA countries
From 2016 to 2023, VERs issuance in the 5 countries has grown steadily with rapid acceleration since 2019 (Figure 1). Growth has slowed since then, notably due to the moratorium in Indonesia, which has been lifted as of mid-October 2025 [1]. Meanwhile, retirement rates rose from below 20% (of overall supply) in the late 2010s to over 65% by 2025, indicating stronger market uptake and improved liquidity.
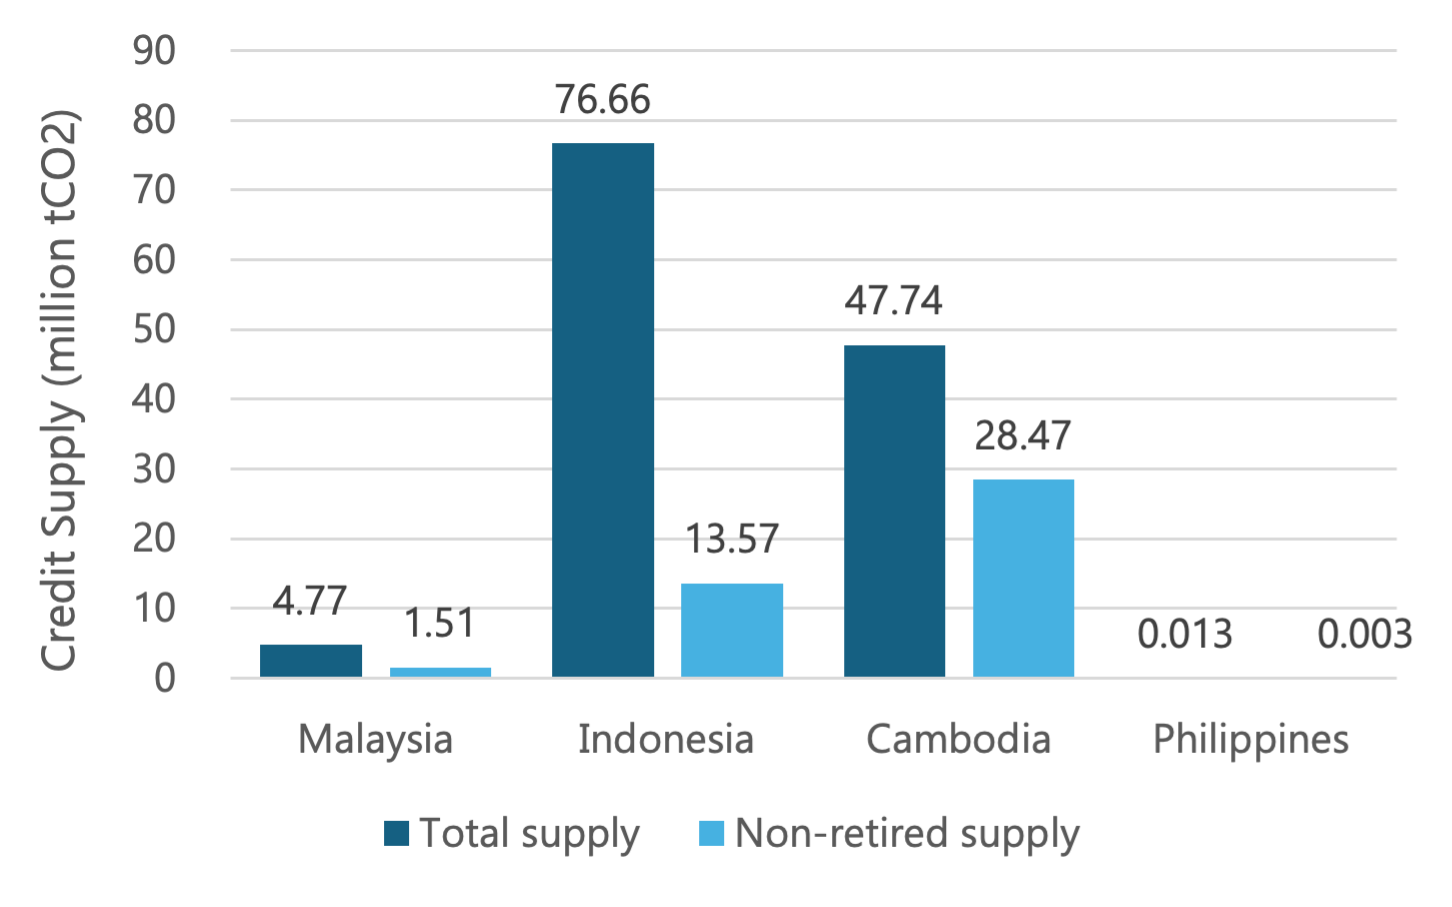
Figure 2 - Total and non-retired carbon credit supply by country (million tCO2)
Supply by Location and Project-Type
As of April 2025, the 5 SEA countries [Footnote 2] had issued 129 million VERs, with Indonesia (59.3%) and Cambodia (37%) accounting for the vast majority, positioning them as the region’s key contributors to the VCM.
Unretired credits, making up the active supply, account for 43 million VERs, with projects in Cambodia (28 million) and Indonesia (13 million) forming the bulk of that.
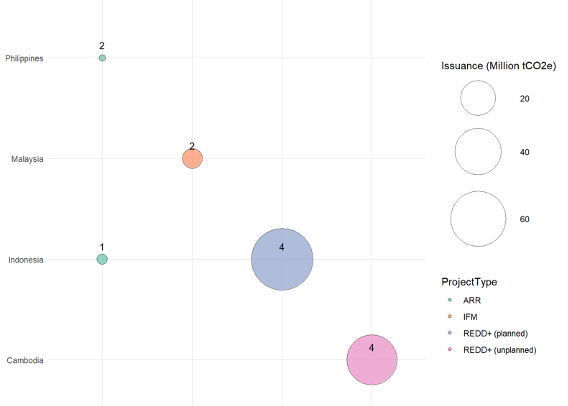
Figure 3 - Distribution of registered carbon credit projects by country and type
Nearly 96% of issued NbS VERs are generated by REDD+ projects [Footnote 3] (Figure 3), primarily in Cambodia and Indonesia. They are typically large-scale and offer high credit yields. Compared to the global overall net forest loss rate of 0.12% per year, Cambodia and Indonesia experienced significantly higher rates of 2.68% and 0.78% during 2010–2020 [2]. The high deforestation rates underscore the urgency of deploying REDD+ interventions, which both countries have prioritised within their NDCs and forest policies.
However, Indonesia and Cambodia differ in the types of REDD+ projects registered. In Indonesia, they are primarily related to avoided planned deforestation, authorised through formal land-use change permits, while those in Cambodia are related to avoided unplanned deforestation tackling informal or illegal forest loss. This likely reflects the dominance of informal drivers (such as unauthorised encroachment and logging) [3] and weaker enforcement capacity in Cambodia’s forest sector [4]. In Cambodia, government-supported projects prioritise illegal forest loss.
Compared to Cambodia, Indonesia possesses a much larger forest area, allowing land-use concessions to be allocated to the private sector while still leaving extensive zones for protection that are not intended for logging. In contrast, Cambodia’s relatively limited forest extent, coupled with ongoing demand for forest conversion, means that concessions held by the government may extend into areas where logging is not legally permitted [4], contributing to the prevalence of illegal forest loss.
Other NbS project types, including Improved Forest Management (IFM) and Afforestation, Reforestation, and Revegetation (ARR), are primarily found in Malaysia and The Philippines, with Indonesia also hosting one ARR project focused on wetland restoration. Together, these project types have contributed to less than 4% of the total supply. Beyond current supply, Malaysia’s 4.94 million ha of degraded land [5], Indonesia’s 24 million ha of degraded areas [6], and the Philippines’ 7.22 million ha of existing forest highlight substantial room to scale ARR and IFM [7].
Section 2: Credit Retirement Performance
Carbon Credit Retirement [8, 9]
Once a carbon credit is retired, it can no longer be traded or resold on the market. Retirement marks the point at which the credit is claimed for offsetting, contributing to overall climate change mitigation and avoiding double counting. Buyers can only claim their offsetting and positive impacts after retirement.
Retirement Performance by Country
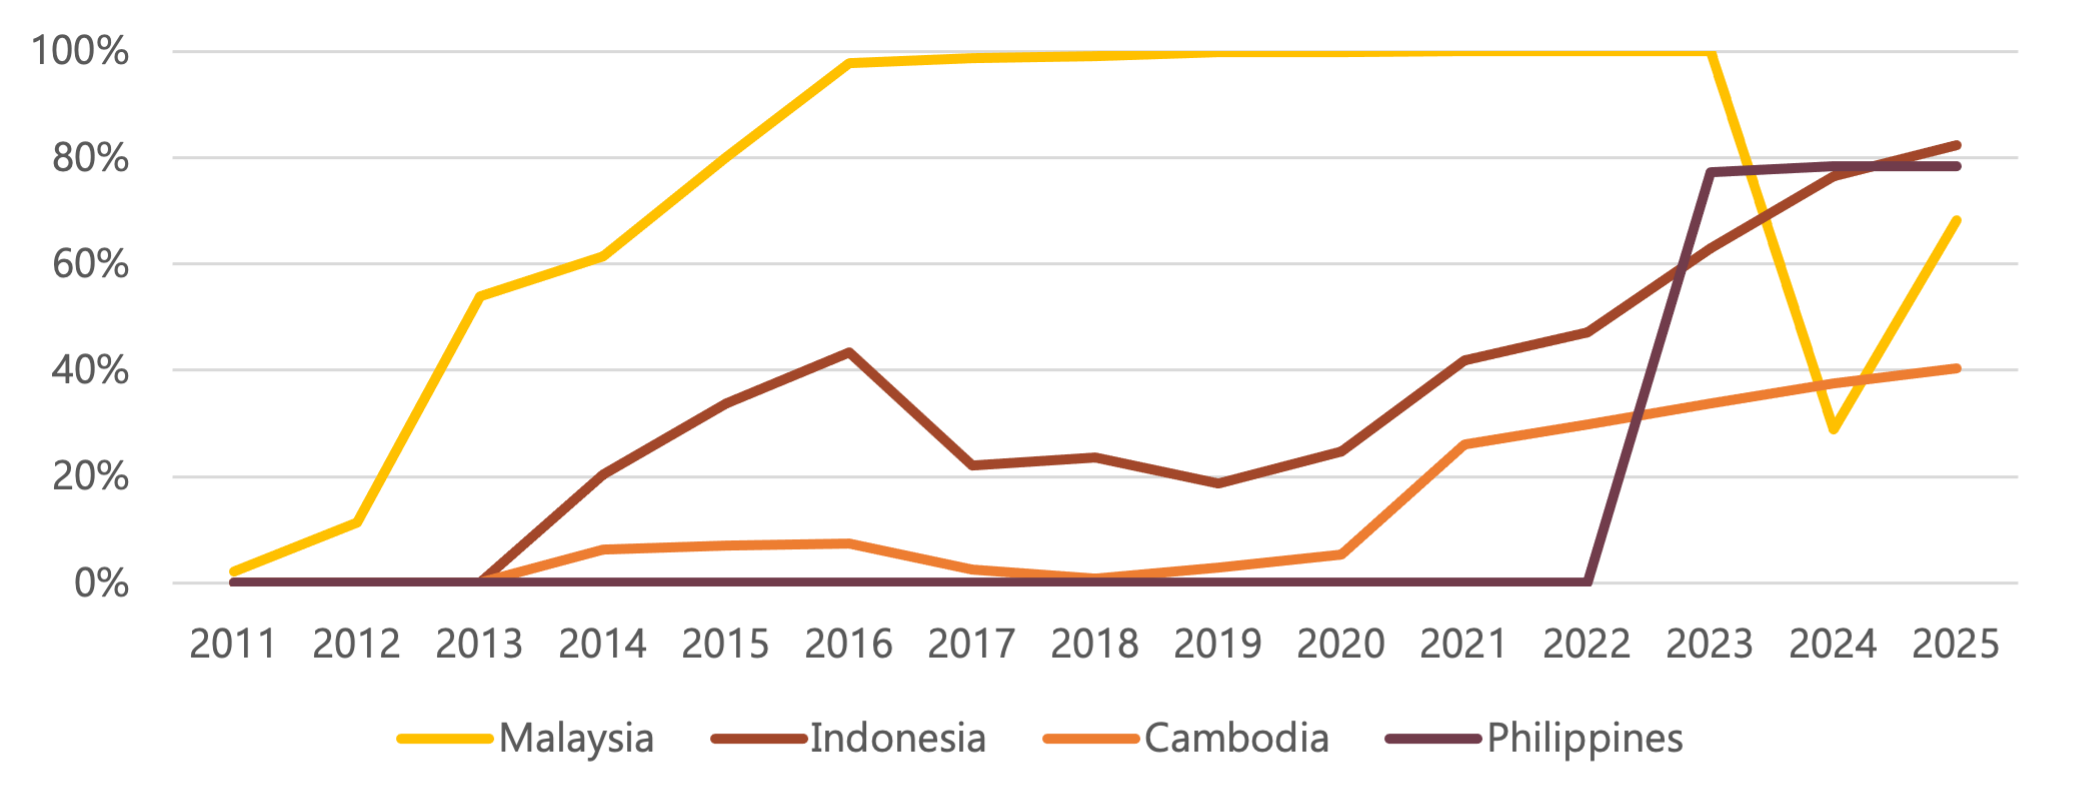
Figure 4 - Cumulative retirement rate of carbon credits by country and project type
Retirement rates vary across countries, reflecting differences in issuance, utilization and market absorption [10]. However, high retirement rates do not always signal strong demand or quality—they may instead reflect issuance timing and scale.
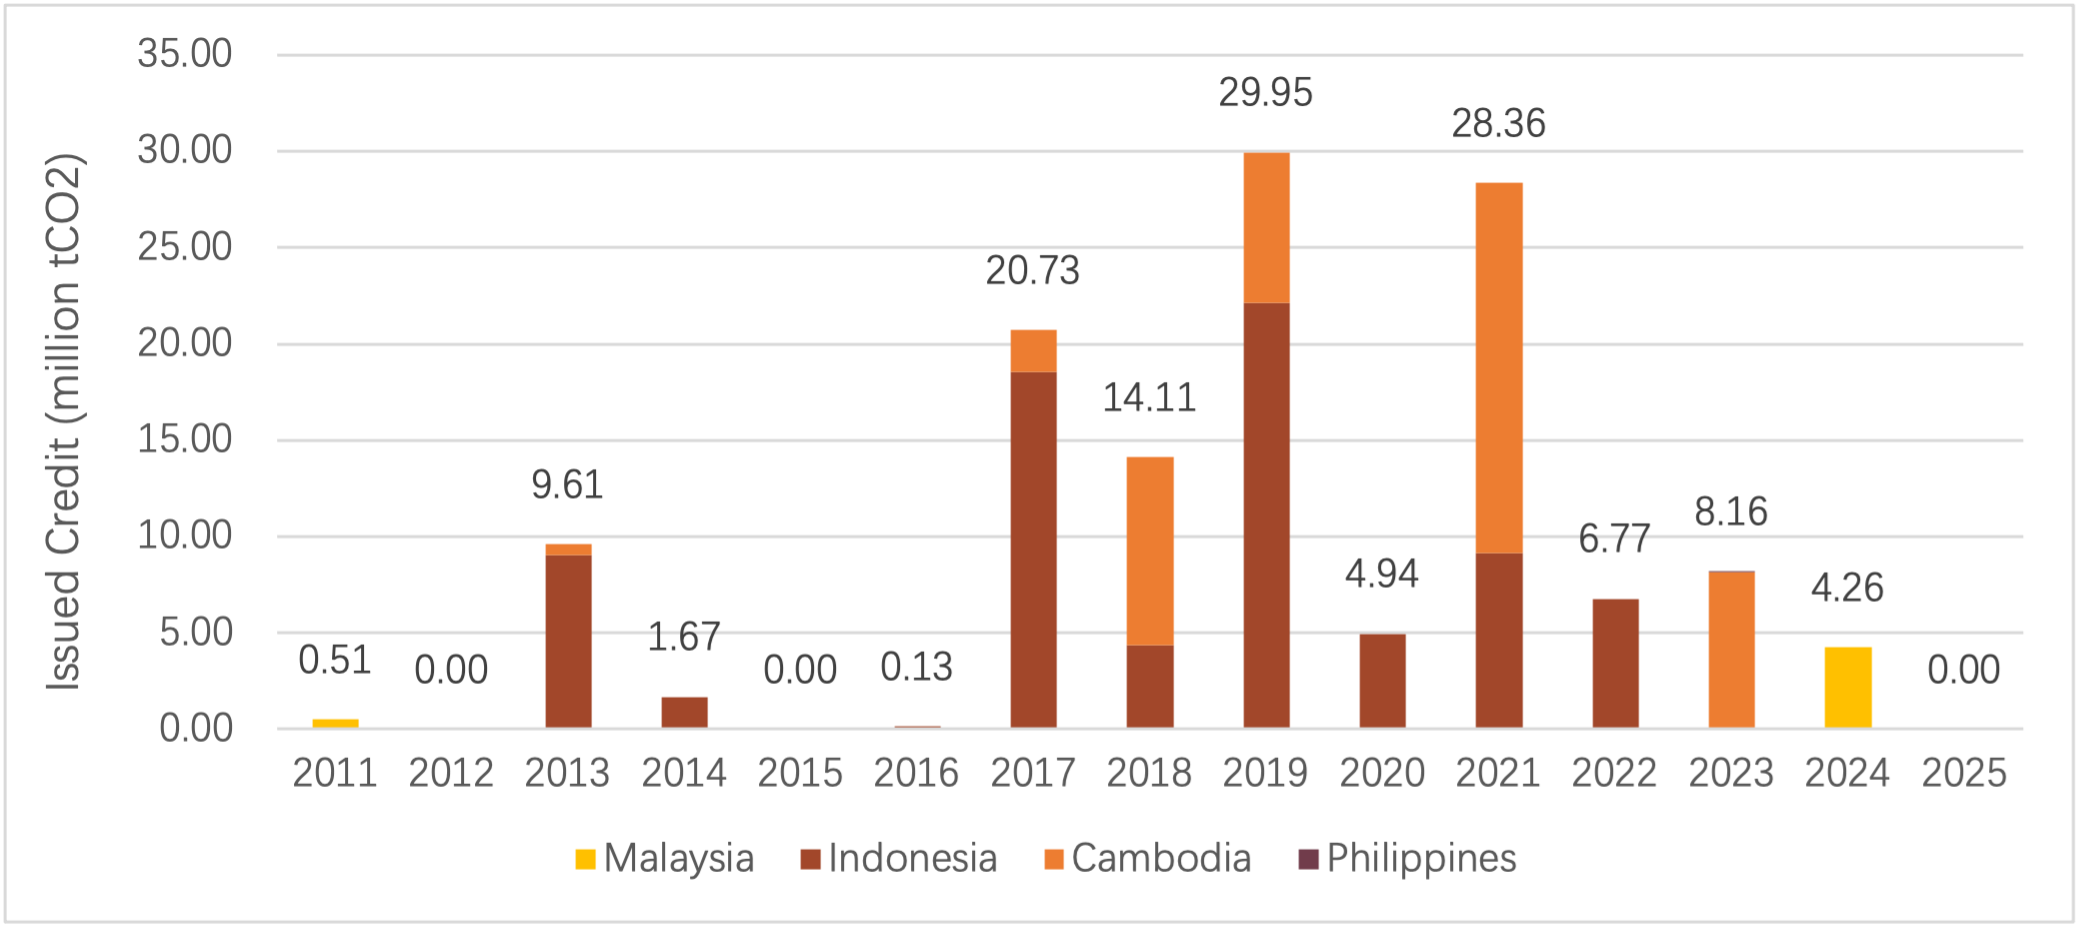
Figure 5 - Annual carbon credit issuance by country
Retirement rates naturally fluctuate with issuance cycles. After an issuance, credits are typically retired over several years, especially for larger projects—as seen in Malaysia between 2011 and 2016. When large new issuances occur (e.g., Malaysia 2023–2025), overall country-level retirement rates may temporarily decline due to a sudden increase in available supply.
It is important to consider the issuance scale with retirement rates. In countries with low issuance volumes like Malaysia and the Philippines, even small retirements can result in high ratios. Although these countries show retirement rates of 68.3% and 78.5%, respectively, they together account for only 3.81% of total regional retirements. While these high rates may reflect strong market uptake, it is equally important to acknowledge that the market has absorbed a substantial volume of credits from major suppliers like Indonesia and Cambodia.
Case Comparison: Indonesia vs Cambodia
Indonesia’s credits appear to receive stronger market uptake than Cambodia’s in REDD+, as indicated by both retirement rates and issuance scale. As of April 2025, Indonesia’s cumulative retirement rate had reached 82.3%, significantly higher than Cambodia’s 40.4%. In absolute terms, Indonesia had issued over 76 million credits, compared to Cambodia’s 47 million. Despite this larger supply, Indonesia still maintains a higher retirement rate, suggesting relatively stronger credit absorption by the market.
Several factors may help explain this difference. One is issuance timing: Indonesia’s last credit issuance occurred in 2022, giving the market more time to absorb the supply, whereas Cambodia continued issuing into 2023. Project quality and perception may also play a role. Indonesian REDD+ projects tend to receive higher ratings from carbon credit rating agencies [11], which draws stronger buying interest. In contrast, some Cambodian projects, such as the Southern Cardamom REDD+, have faced reputational challenges over reported rights violations [12], which could weaken buyer confidence.
Retirement by Mitigation Type
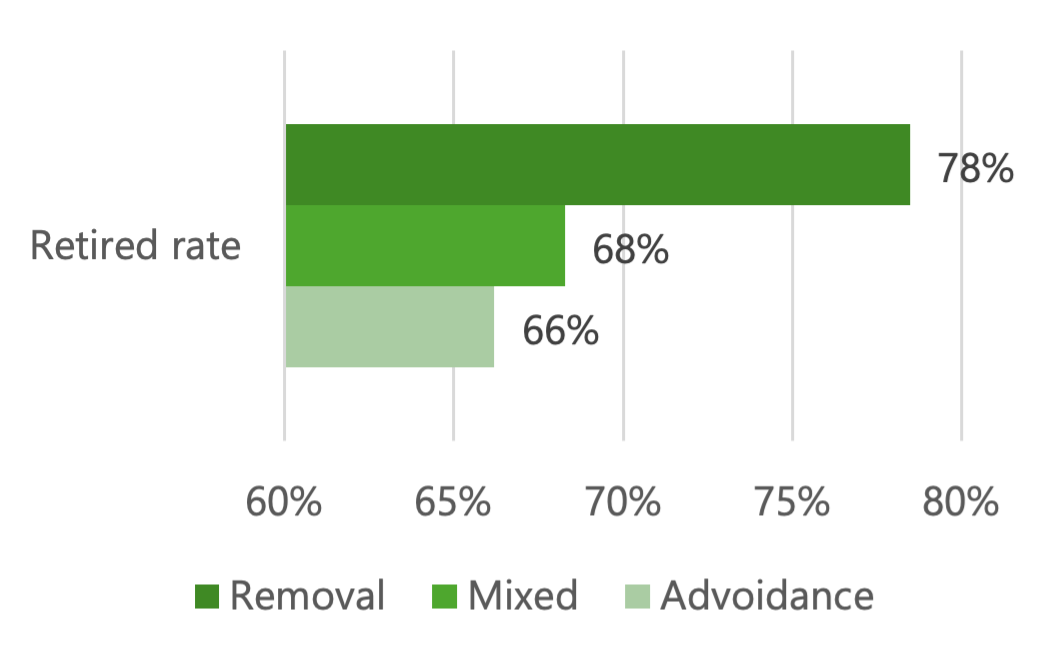
Figure 6 - Retirement rate (left) and overall supply (right) by mitigation type [Footnote 4].
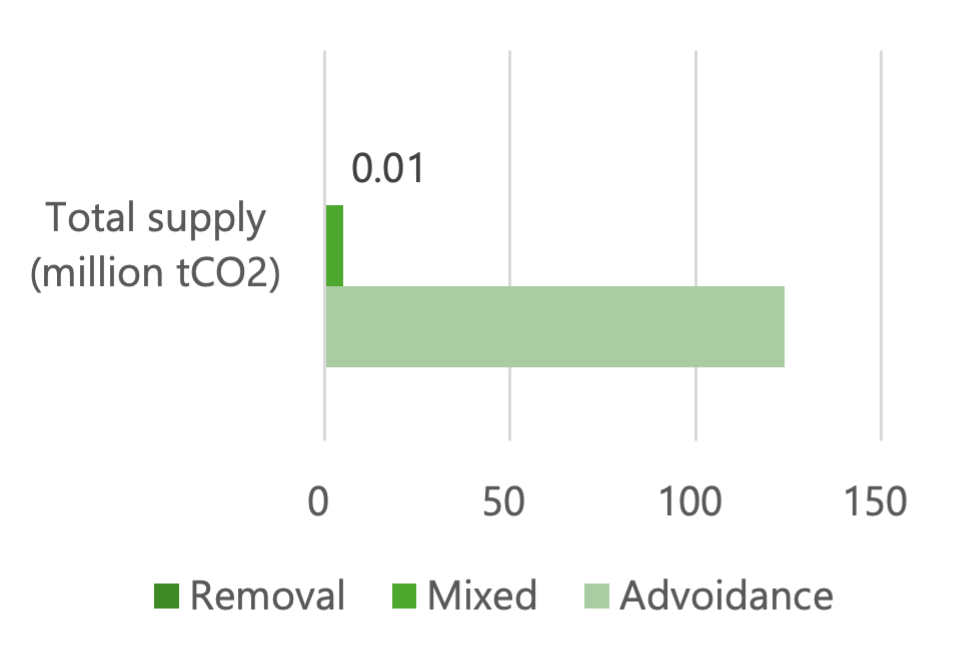
Removal and mixed nature credits (such as IFM combining both avoided emissions and carbon removal) show better retirement performance, and lower supply. Removal credits have a higher retirement rate of 78%, followed by mixed (68%) and avoidance (66%) [Footnote 5], reflecting buyer preference in emissions offsetting, potentially sparked by reporting frameworks like the Science Based Targets initiative (SBTi), giving more importance to this type of credits for offsetting [13].
Section 3: Future Supply Potential and Thailand’s Domestic Supply
Projects Pipeline Under VCS and GS
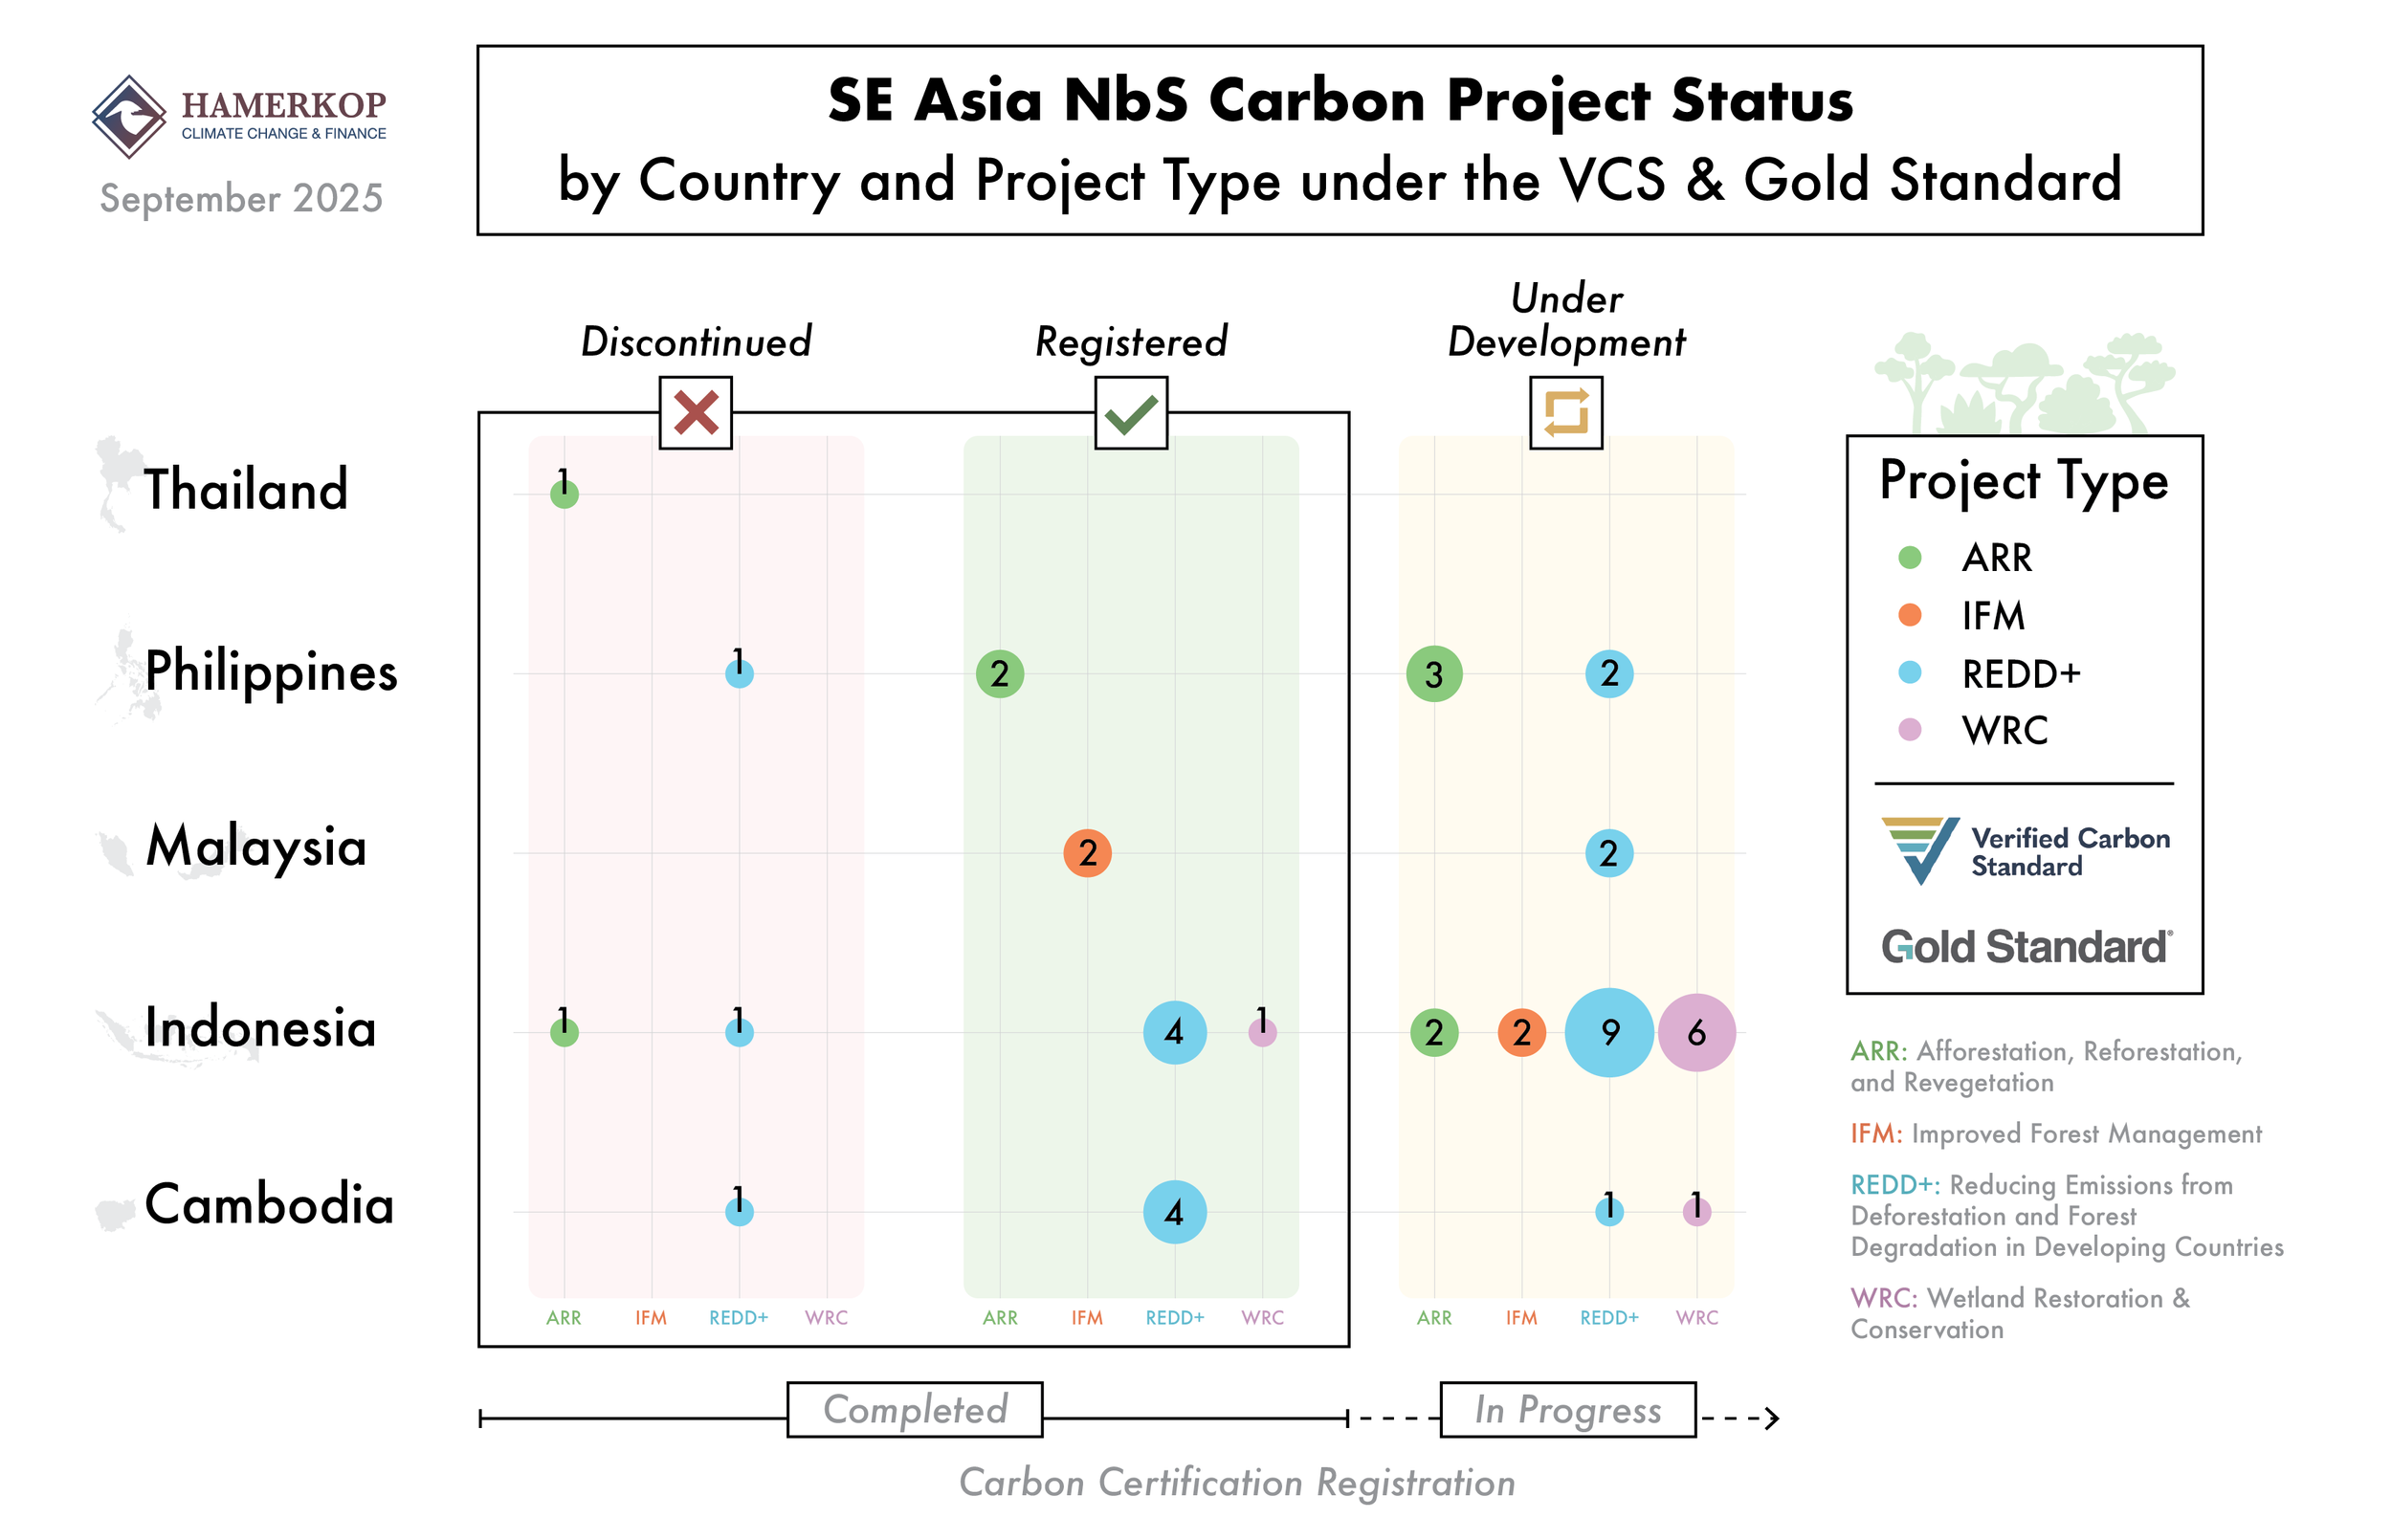
Figure 7 - Status of NbS projects by country and type under Verra and Gold Standard
Across the 5 countries, a total of 46 projects have been established, with over 60% (28 projects) still under development. This signals a robust pipeline for future credit issuance, particularly in Indonesia, which alone hosts 19 projects under development and features a diversified mix of ARR, IFM, REDD+, and WRC (Wetland Restoration and Conservation) types, underscoring both its strong track record and forward-looking potential. Meanwhile, the Philippines shows a strong presence and potential growth in ARR, while both it and Malaysia are exploring REDD+ development.
The signing of a Mutual Recognition Agreement (MRA) between Indonesia and the GS in May 2025, followed by Plan Vivo, Global Carbon Council and Verra are key signals of a policy normalization process. Yet, as of October 2025, there was no historical transaction of NbS VERs through the Indonesian domestic system (i.e., SPE-GRK). These moves are expected to unlock previously stalled projects and restore market confidence, potentially reviving issuance growth from 2025 onward.
Thailand’s T-VER Supply
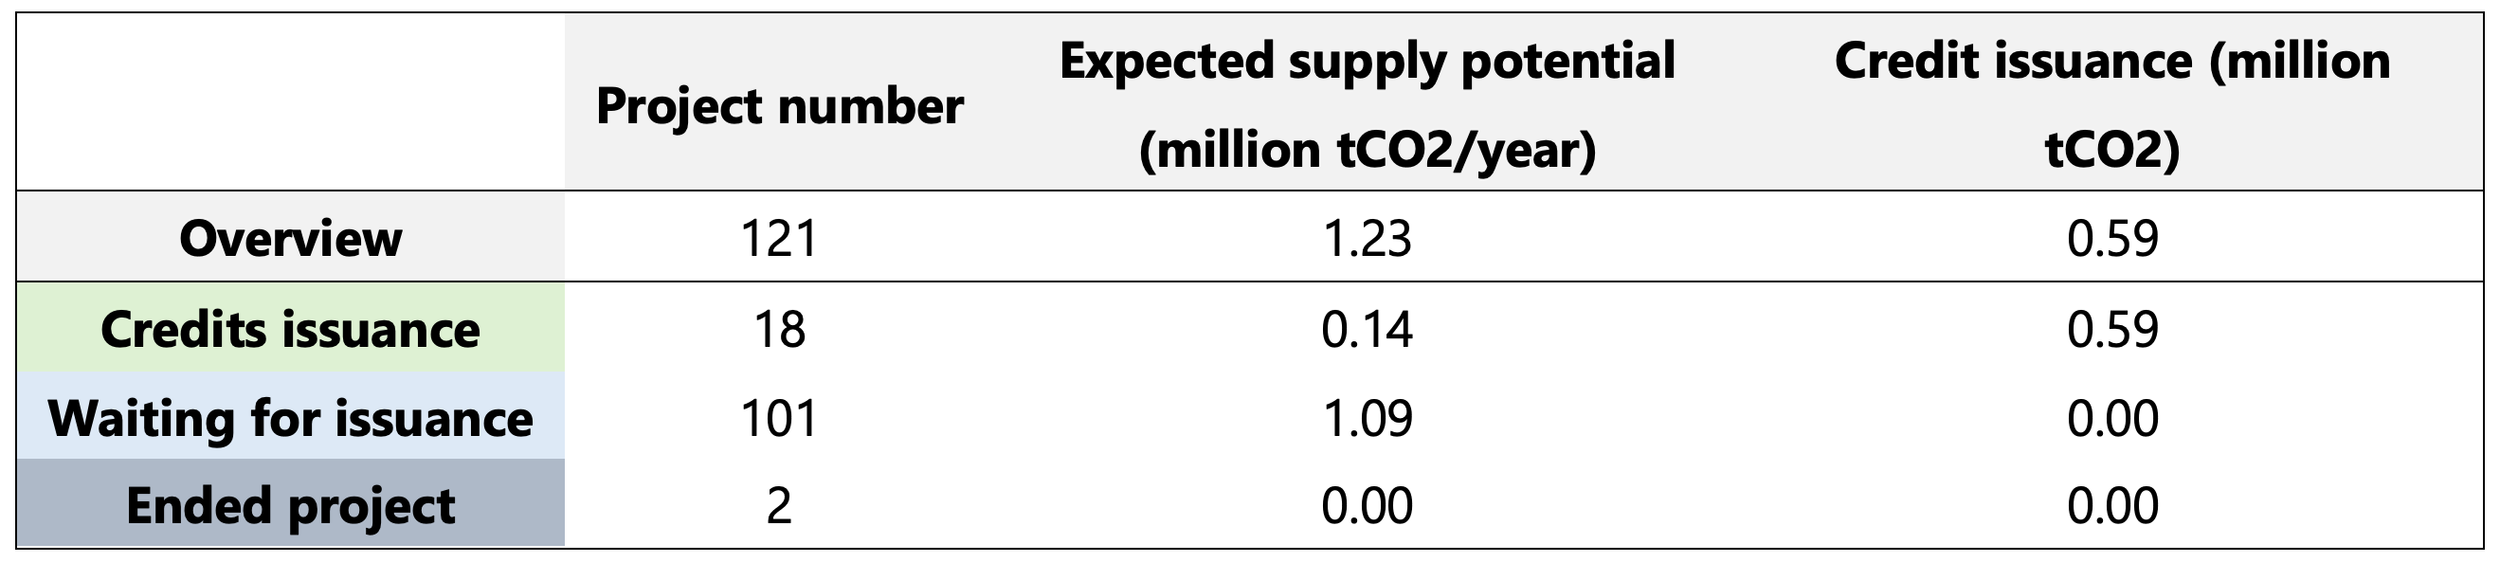
Figure 8 – Projects pipeline under T-VER System (forestry and agriculture sectors)
Thailand currently has no NbS projects registered under the VCS or the GS, and has developed its own VER program, operating since 2013. Under the forestry and agriculture sectors, it has issued 587,688 VERs from 18 projects (0.14 million tCO2e/year). However, these issuing projects collectively account for only 11% of the total estimated annual reduction across all 121 listed projects (1.23 million tCO2e/year), highlighting the scale of unrealised supply in the future.
Looking ahead, 101 registered yet non-issuing projects are expected to generate around 1.08 million VERs annually once credits are issued. Altogether, the T-VER pipeline could supply approximately 1.23 million VERs per year to both domestic and international markets, suggesting significant untapped potential, with more credits likely to be released in the near future.
Footnotes:
[1] The 5 countries analysed account for 99.5% of total NbS credit issuance in Southeast Asia, based on data from the Berkeley Database, covering credits issued under VCS and GS as of April 2025.
[2] Thailand is included in the overall analysis scope but is excluded from Sections 1 and 2 due to the absence of active NbS projects under international standard. Its domestic T-VER program is discussed separately in Section 3.
[3] Project types were adapted from original database, with refinements for analytical clarity. The only registered WRC project was classified as ARR based on its methodology. REDD+ projects were divided into planned and unplanned categories due to their dominant share of issuance and the specific circumstances of each project.
[4] Mitigation type classification follows the Berkeley Voluntary Offsetting Database, based on project methodologies.
[5] Reclassify the mitigation type from “reduction” to “avoidance”, aligning with NbS carbon effect typology.
References:
[1] Times, T.S. 2025 [cited 2025 November 17]; Available from: https://www.straitstimes.com/asia/se-asia/indonesia-allows-resumption-of-international-carbon-trade-after-four-years.
[2] Sarre, A., Global forest resources assessment, 2020: Main report. 2020: Food and Agriculture Organization of the United Nations.
[3] Ken, S., et al., Assessment of the local perceptions on the drivers of deforestation and forest degradation, agents of drivers, and appropriate activities in Cambodia. Sustainability, 2020. 12(23): p. 9987.
[4] Trends, F., Timber Legality Risk Dashboard: Cambodia. 2022.
[5] Malaysia, G.o., Malaysia national report to the United Nations Convention to Combat Desertification (2019 reporting year). 2019, United Nations Convention to Combat Desertification.
[6] Indonesia, W.R.I. Good data could save two million hectares of degraded conservation areas. 2019 [cited 2025 November 18]; Available from: https://wri-indonesia.org/en/insights/good-data-could-save-two-million-hectares-degraded-conservation-areas.
[7] Philippines, C.C.C. Keeping up with deforestations. 2024 [cited 2025 November 17]; Available from: https://climate.gov.ph/news/851.
[8] Toucan. What are carbon credit retirements? 2023; Available from: https://blog.toucan.earth/carbon-credit-retirement/.
[9] Wikipedia. Carbon retirement. n.d.; Available from: https://en.wikipedia.org/wiki/Carbon_retirement.
[10] Sylvera, in Carbon Markets: 5 Key Takeaways for 2025 Strategies. 2024.
[11] EcoAct. Katingan Mentaya Project achieves AA rating from BeZero Carbon. 2024; Available from: https://www.linkedin.com/posts/ecoactuk_climateaction-carbonmarkets-sustainability-activity-7303087248390914048-dOEo/.
[12] Watch, H.R., Carbon Offsetting’s Casualties: Violations of Chong Indigenous People’s Rights in Cambodia’s Southern Cardamom REDD+ Project. 2024.
[13] CarbonOffsetGuide. Using Carbon Credits: Issues and Considerations. n.d.; Available from: https://offsetguide.org/using-carbon-credits-issues-and-considerations/.